Top 5 DAX tricks for super effective Power BI dashboards
Are you interested in knowing the tricks that can enhance the usability and user-friendliness of your dashboards in Power BI? You have come to the right place.
Simply watch the recording to learn about the top 5 DAX tricks for super effective Power BI dashboards.
Wat je leert:
Presentator


Founder & CEO at Zebra BI
Andrej brings 25 years of experience in business intelligence and software development and 20 years as a consultant. Helping numerous international and regional companies achieve consistent and efficient internal reporting throughout the organization inspired him to build Zebra BI.
Don't miss this opportunity to learn about the top 5 DAX tricks in Power BI!
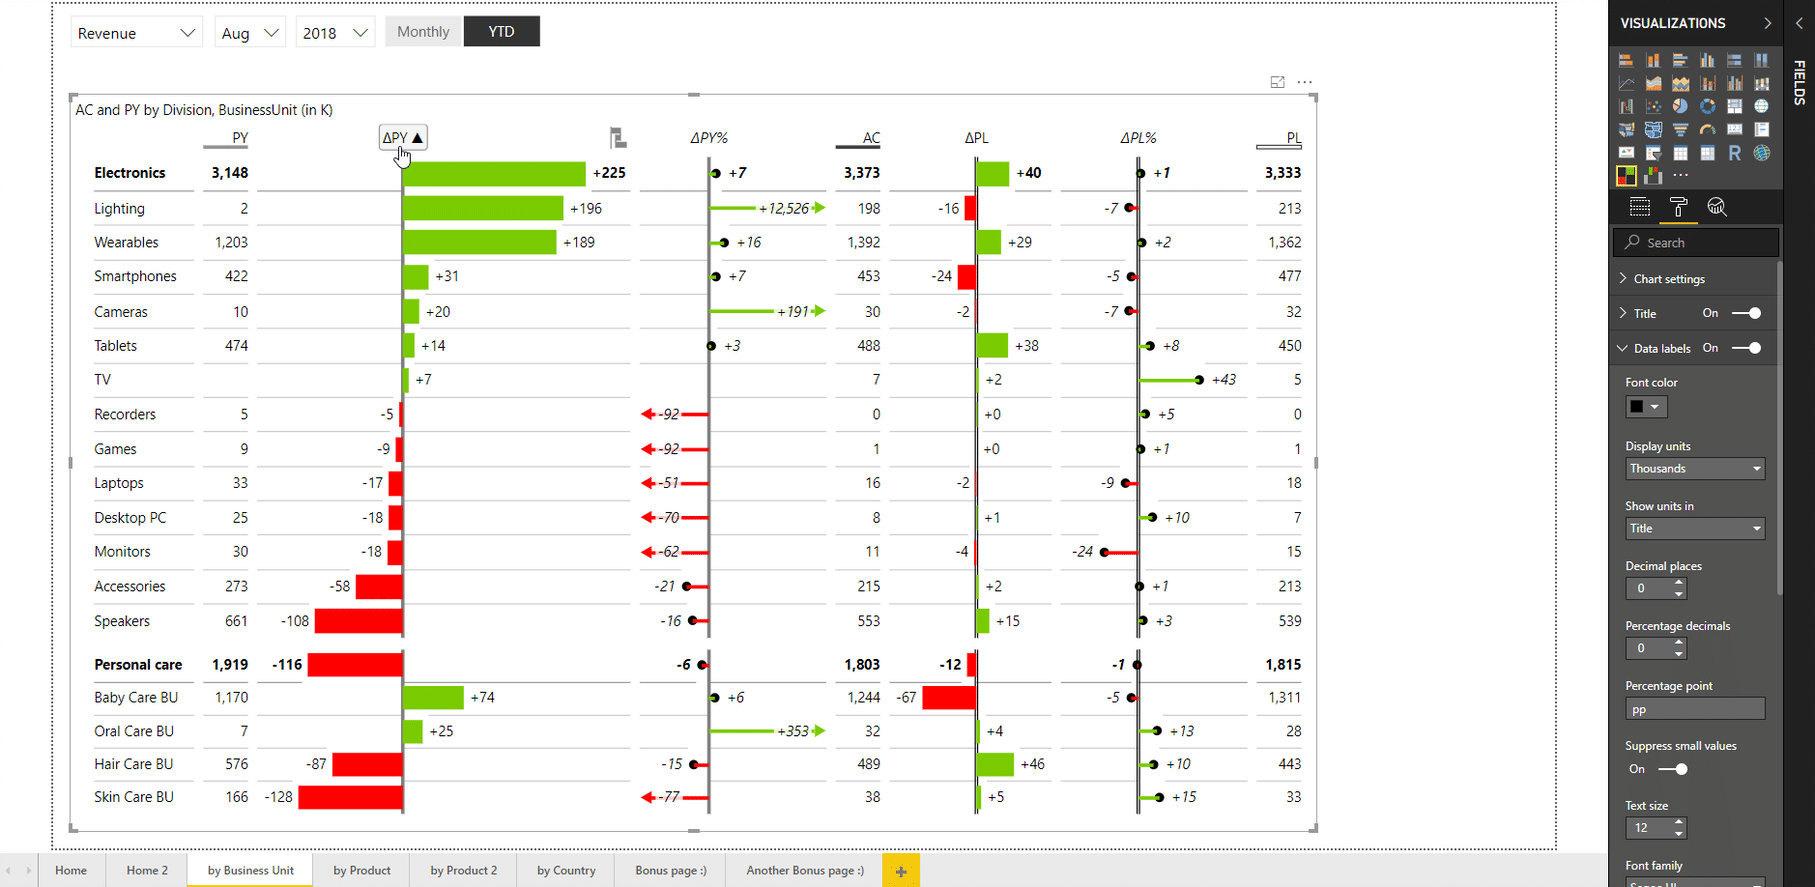
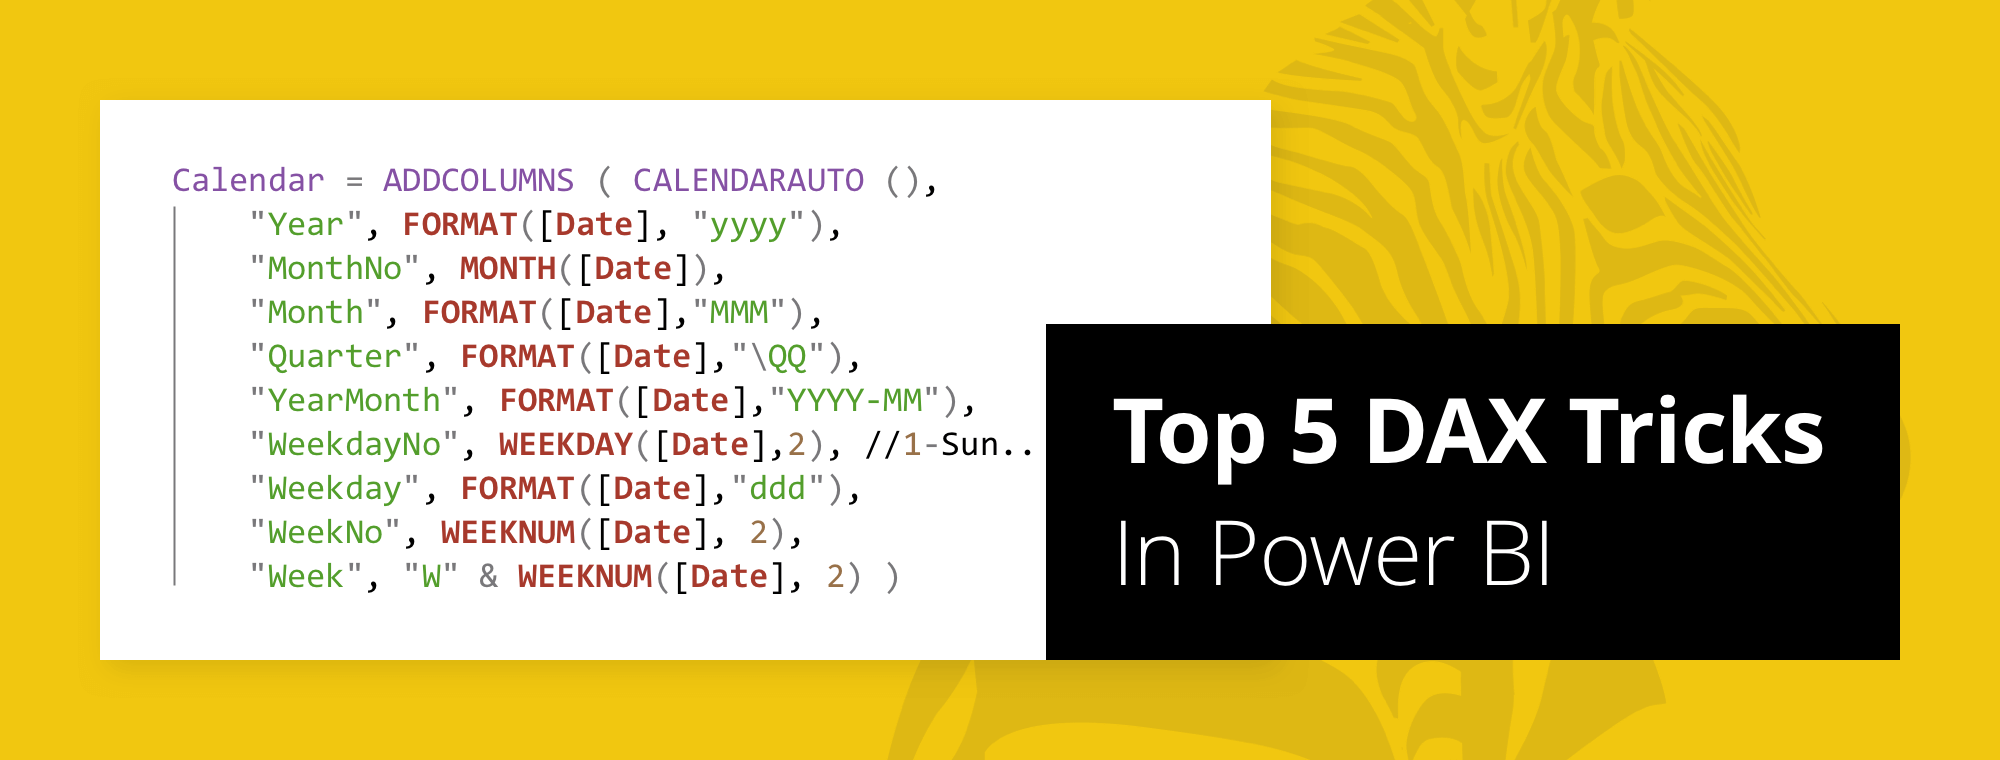
Power BI is an awesome tool and we tend to see many beautiful and colourful dashboards there. However, sometimes they tend to get too complicated and not as effective as they could be. If you need some tips on how to create calendar dimensions, adding new columns, building a dashboard and how to build the MTD/YTD switch and the KPI switch (slicer), you'll find the answers in the webinar.
Our host, Andrej Lapajne, CEO and Founder of Zebra BI, decided to share some of DAX modelling best practices and tricks with the goal to help you speed up the creation of your dashboards in reports and make them easier to maintain in the future.
Bekijk op aanvraag
Watch the video

Zebra BI-webinars zijn al bezocht door meer dan 10.000 deelnemers!