Practical Rules for Visualizing Budgets, Plans and Forecasts in Excel
In this webinar, you will learn best practices for designing efficient budget, plan and forecast reports.
Wat je leert:
Presentator


Founder & CEO at Zebra BI
Andrej brings 25 years of experience in business intelligence and software development and 20 years as a consultant. Helping numerous international and regional companies achieve consistent and efficient internal reporting throughout the organization inspired him to build Zebra BI.
How to take the design of your budget, plan and forecast reports to the next level?
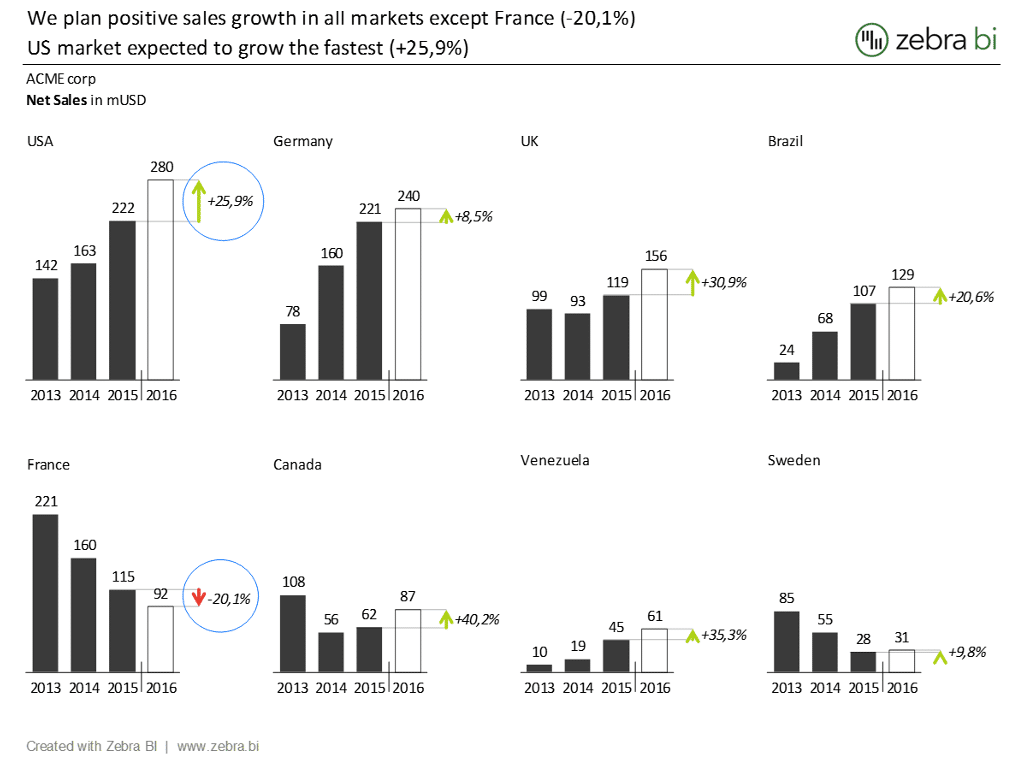
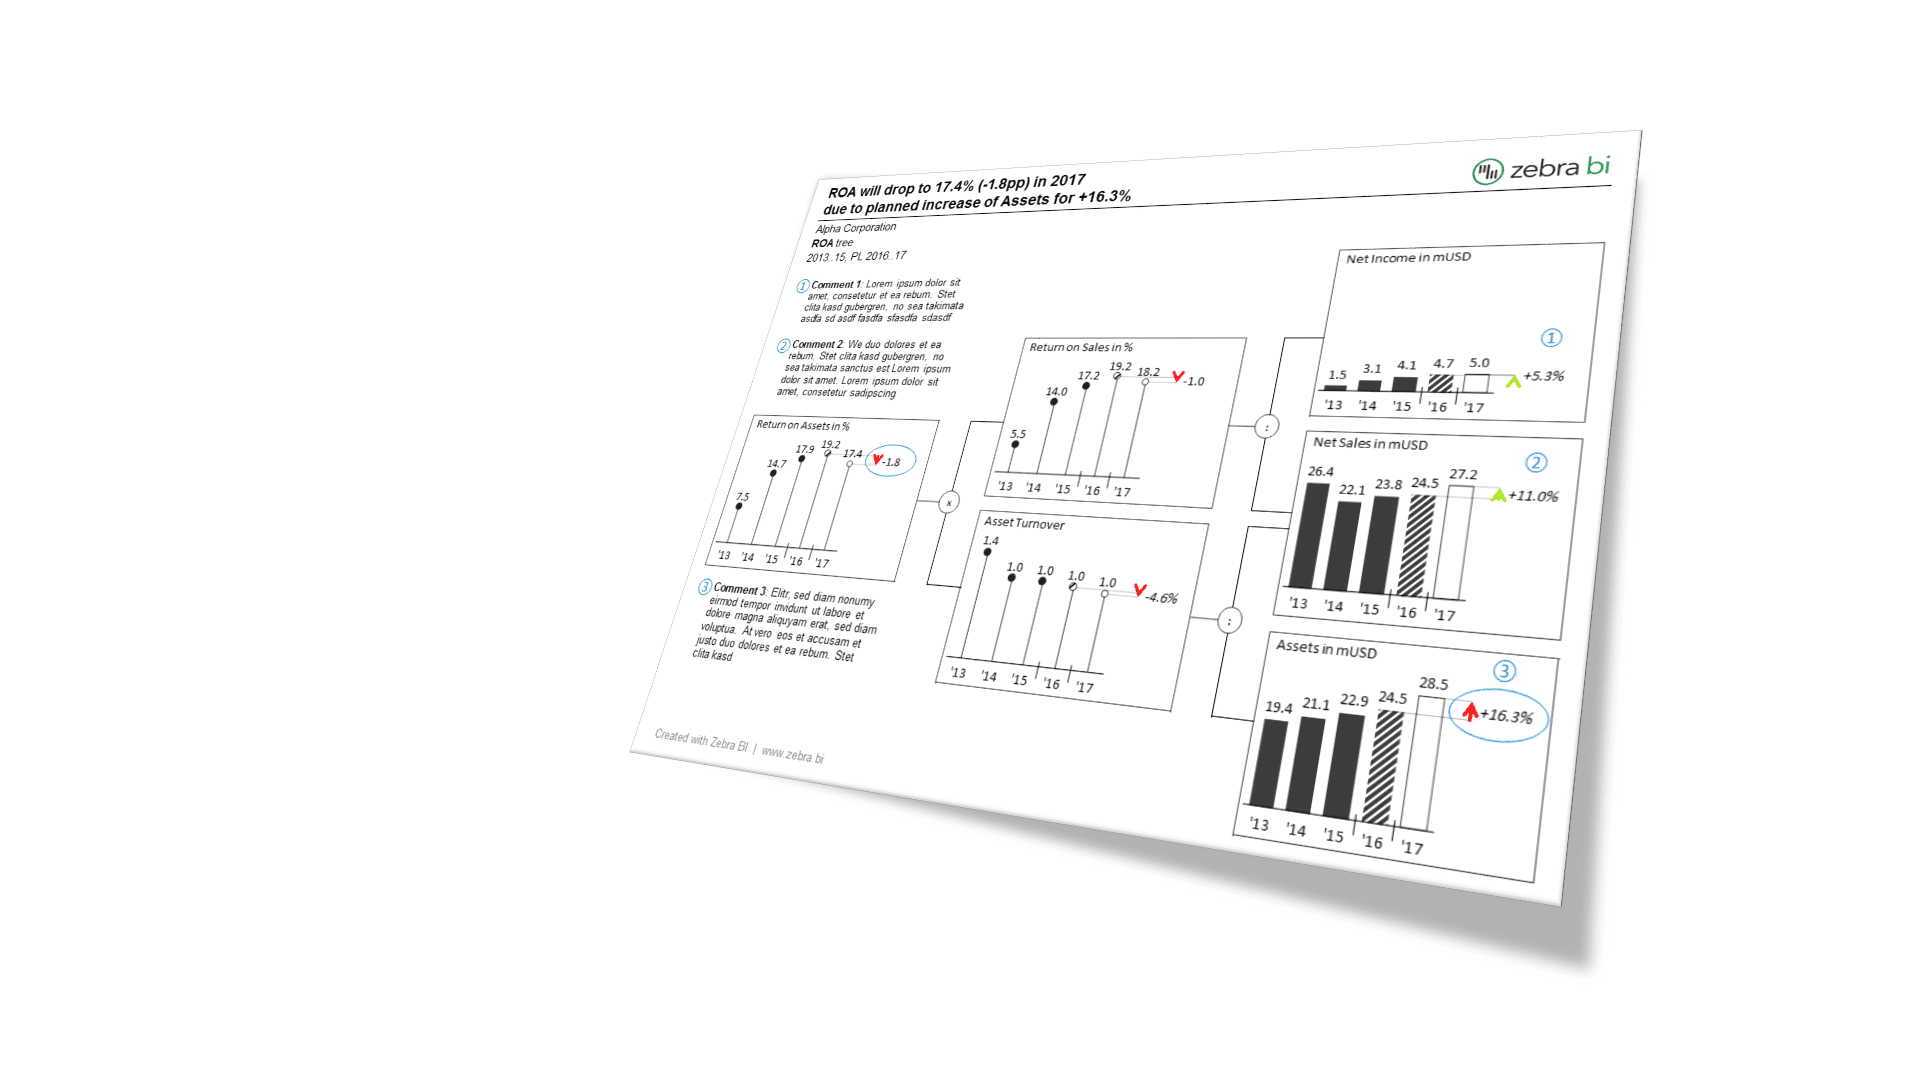
The last stage when preparing the budgets, plans and forecasts for next year is the presentation. The typical way to do this is still to use good old plain tables in Excel.
A much better approach is to use some cleverly thought-out visualizations for your data. It might even get you a raise! 🙂
In this webinar, you'll find out exactly how to do it in Excel!
Bekijk op aanvraag
Watch the video
Zebra BI-webinars zijn al bezocht door meer dan 10.000 deelnemers!