Share this
11 Ways of Tracking Monthly Variances in FP&A


In this webinar, you'll learn about all the different visualizations of variances - from the basic to the most advanced.
We will also discuss all the latest time-tested Excel templates to start designing standardized best-practice variance reports for your company.
You'll learn:
Presenter


Founder & CEO at Zebra BI
Andrej brings 25 years of experience in business intelligence and software development and 20 years as a consultant. Helping numerous international and regional companies achieve consistent and efficient internal reporting throughout the organization inspired him to build Zebra BI.
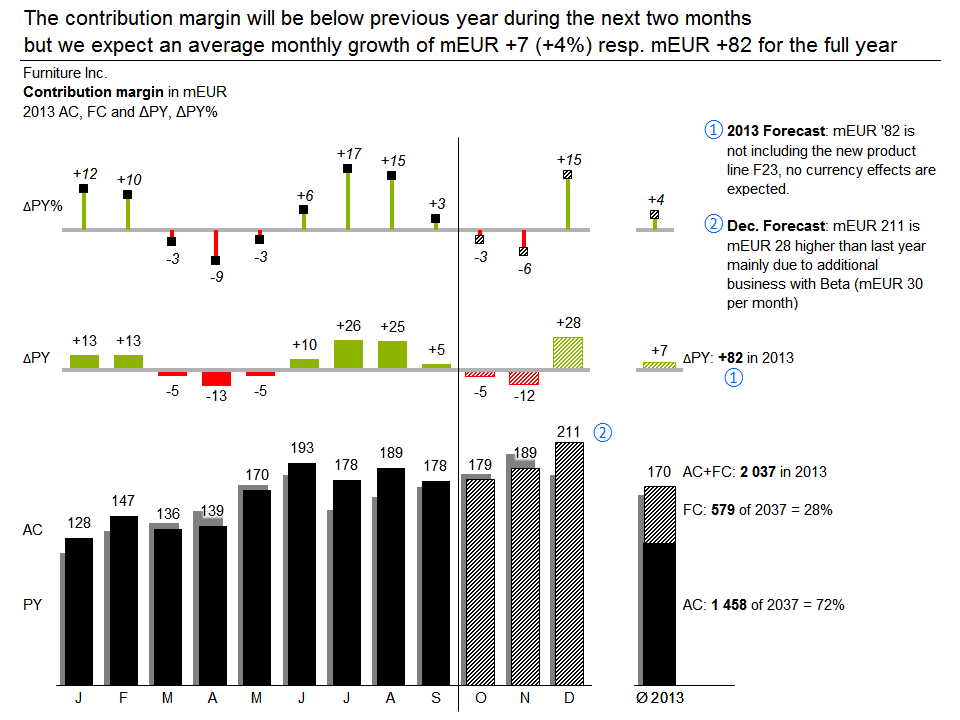
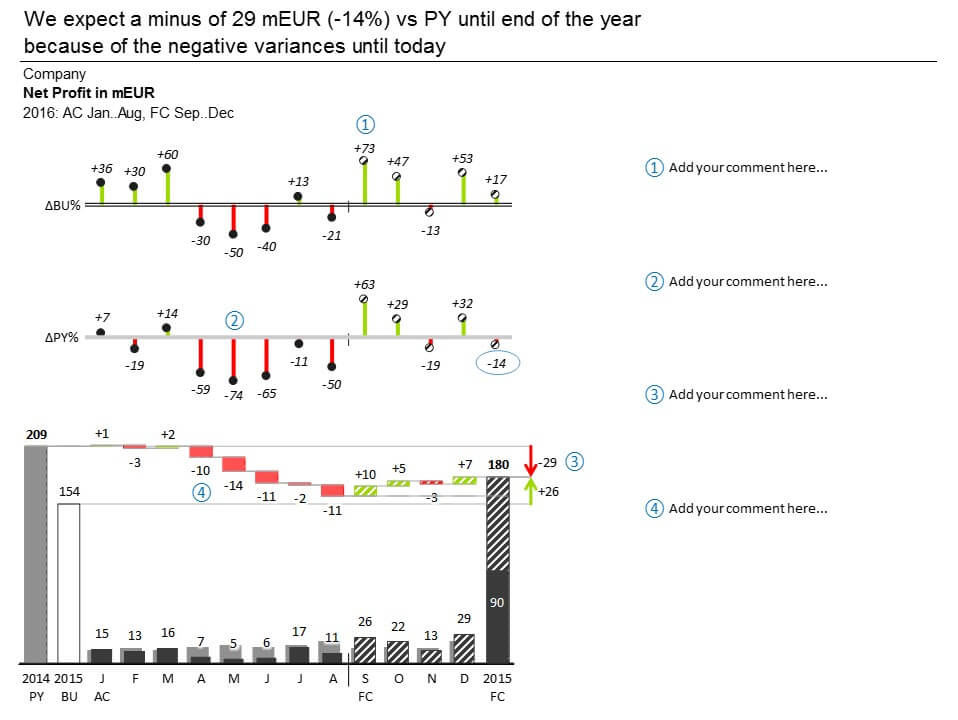
Learn best practices for visualizing monthly, quarterly, YTD and other variances
Comparing actual values with the previous year, budget and forecast on a monthly/quarterly/year-to-date basis is a core activity for all FP&A, controlling and other financial professionals. There are so many options for displaying and analyzing these variances that many users can't decide which one to use, so they stick to using plain tables and default Excel charts.
Join our host Andrej Lapajne, CEO and Founder of Zebra BI as he explains basic and advanced visualizations of variances. At the same time, he will discuss the latest Excel templates which will help you to follow best practices while creating standardized variance reports.