Author: Ziga Milek

October 27, 2022
Daily Sales Flash in Power BI
The Daily Sales Flash Power BI dashboard features a number of neat little tricks to allow users to get a clear view of their data on a daily basis.
August 22, 2022
HR Analytics in Power BI
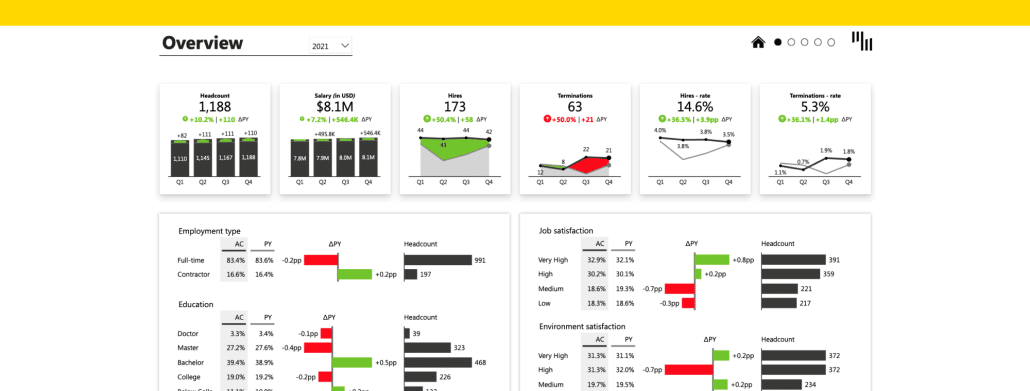
The Human Resources Power BI dashboard allows users to get a clear overview of the company's employees and the most relevant top-level KPIs: Headcount, Salaries, Hires and Terminations.
July 19, 2022
Working Capital in Power BI
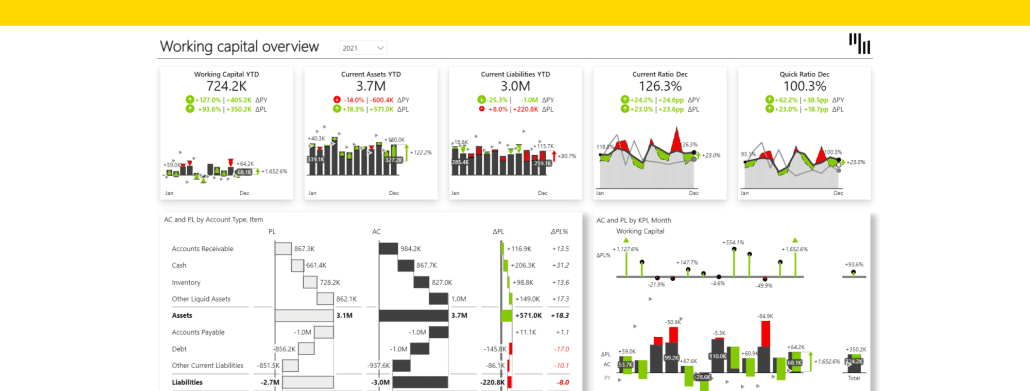
This Power BI template allows you to have a clear overview of the Current Assets, Current Liabilities and the difference between them. You can understand the balance sheet at a glance and analyze the trends of each KPI.
February 24, 2022
Join us at the Enterprise Analytics Summit
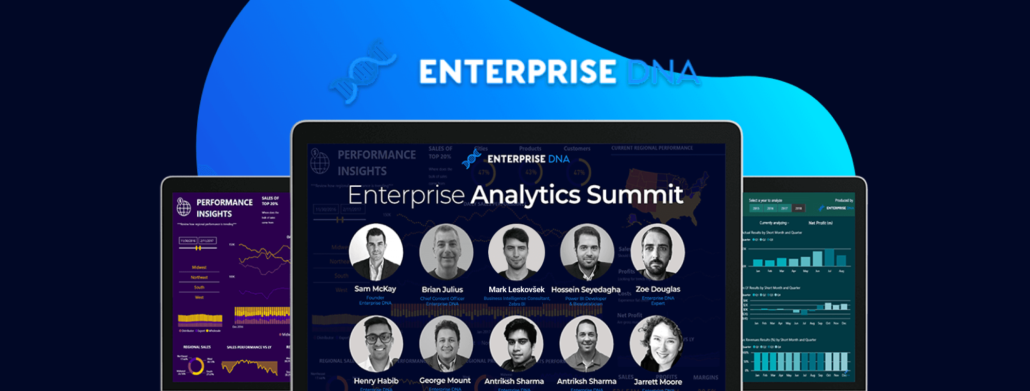
Register for the Enterprise Analytics Summit and hear about the importance of Actionable Reporting from Zebra BI. This is a free event consisting of 22 training sessions in 5 days and thousands of attendees.
February 22, 2022
PUG New Zealand: discover Actionable Reporting with Zebra BI Cards
PUG New Zealand and discover key elements of Actionable Reporting with the showcase of the new visual.
February 19, 2022
Learn about key elements of Actionable Reporting at the Power BI Bootcamp
Join us at the Global Power Platform Bootcamp 2022! You will be able to hear about key elements of Actionable Reporting from our side.
December 22, 2021
Zebra BI named to Deloitte's list of the fastest-growing tech companies in the region
Zebra BI has been named to the Deloitte Technology Fast 50, a ranking of the 50 fastest-growing tech companies in the region.
December 16, 2021
The new Zebra BI Cards visual featured in the Microsoft Power BI December Update
The new Zebra BI Cards visual was featured in the Microsoft Power BI Blog. Discover what did they say about the new visual and other features.
December 14, 2021
Zebra BI presents Cards: a game-changer for visualizing KPIs in Power BI
Zebra BI has launched the new Power BI visual Zebra BI Cards. The new visual is transforming the way of presenting the company’s KPIs.