Use data to tell a story with PowerPoint slides

Create stunning presentations with actionable charts and interactive tables that will completely change your meetings for the better.

Supercharge slides with interactive charts and tables

PowerPoint is a great tool for presentations but its native  charting capabilities are very limited. To make things worse, lots of charts end up being added as screenshots from somewhere else. 

Zebra BI makes your life easier. A lot. A series of advanced charts and tables with integrated charts are available with just one click in PowerPoint. Get ready to crush your meetings.

Compare numbers to plan, forecast, or previous year 

With so much data available, it's no longer enough to show just the numbers. You need to put them in context.

What better way to do it than by letting Zebra BI automatically calculate absolute & relative variances for you? This way, you don't just get the performance but also its comparison with other relevant measures like a plan, previous year, or forecast.

Explain the 'why' behind the data

After you get the variances that help you understand what is going on, you also want to present the why. And you only have a couple of seconds to get the attention.

Use integrated dynamic comments and point attention to the areas where it is needed. Explain the why and deliver actionable insights to people who make decisions. 

Try Zebra BI for PowerPoint for FREE!

Try it on your data

Seamlessly link data from Excel

.With Zebra BI you can effortlessly link your PowerPoint visualizations to your datasets in Excel (which can even be connected to a Power BI source).

This way you ensure the single source of truth across the whole organization.🎯

Before the meeting, you can refresh your source data and have the latest version available. It takes seconds.

Apply your company branding

All your reports, dashboards, and presentations can now effortlessly match your company branding.

By uploading your JSON theme once to the style editor, all your reports and slides in Excel and PPT will match the company branding automatically.

'Zero clicks' is the new policy.

Align teams on a single source of truth

No need to spend hours combining different parts and versions of presentations before each monthly company meeting.

Use Zebra BI and let your colleagues work on a single version either in desktop or online environment and facilitate collaboration before and during a meeting.

Here's why analytics leaders love it

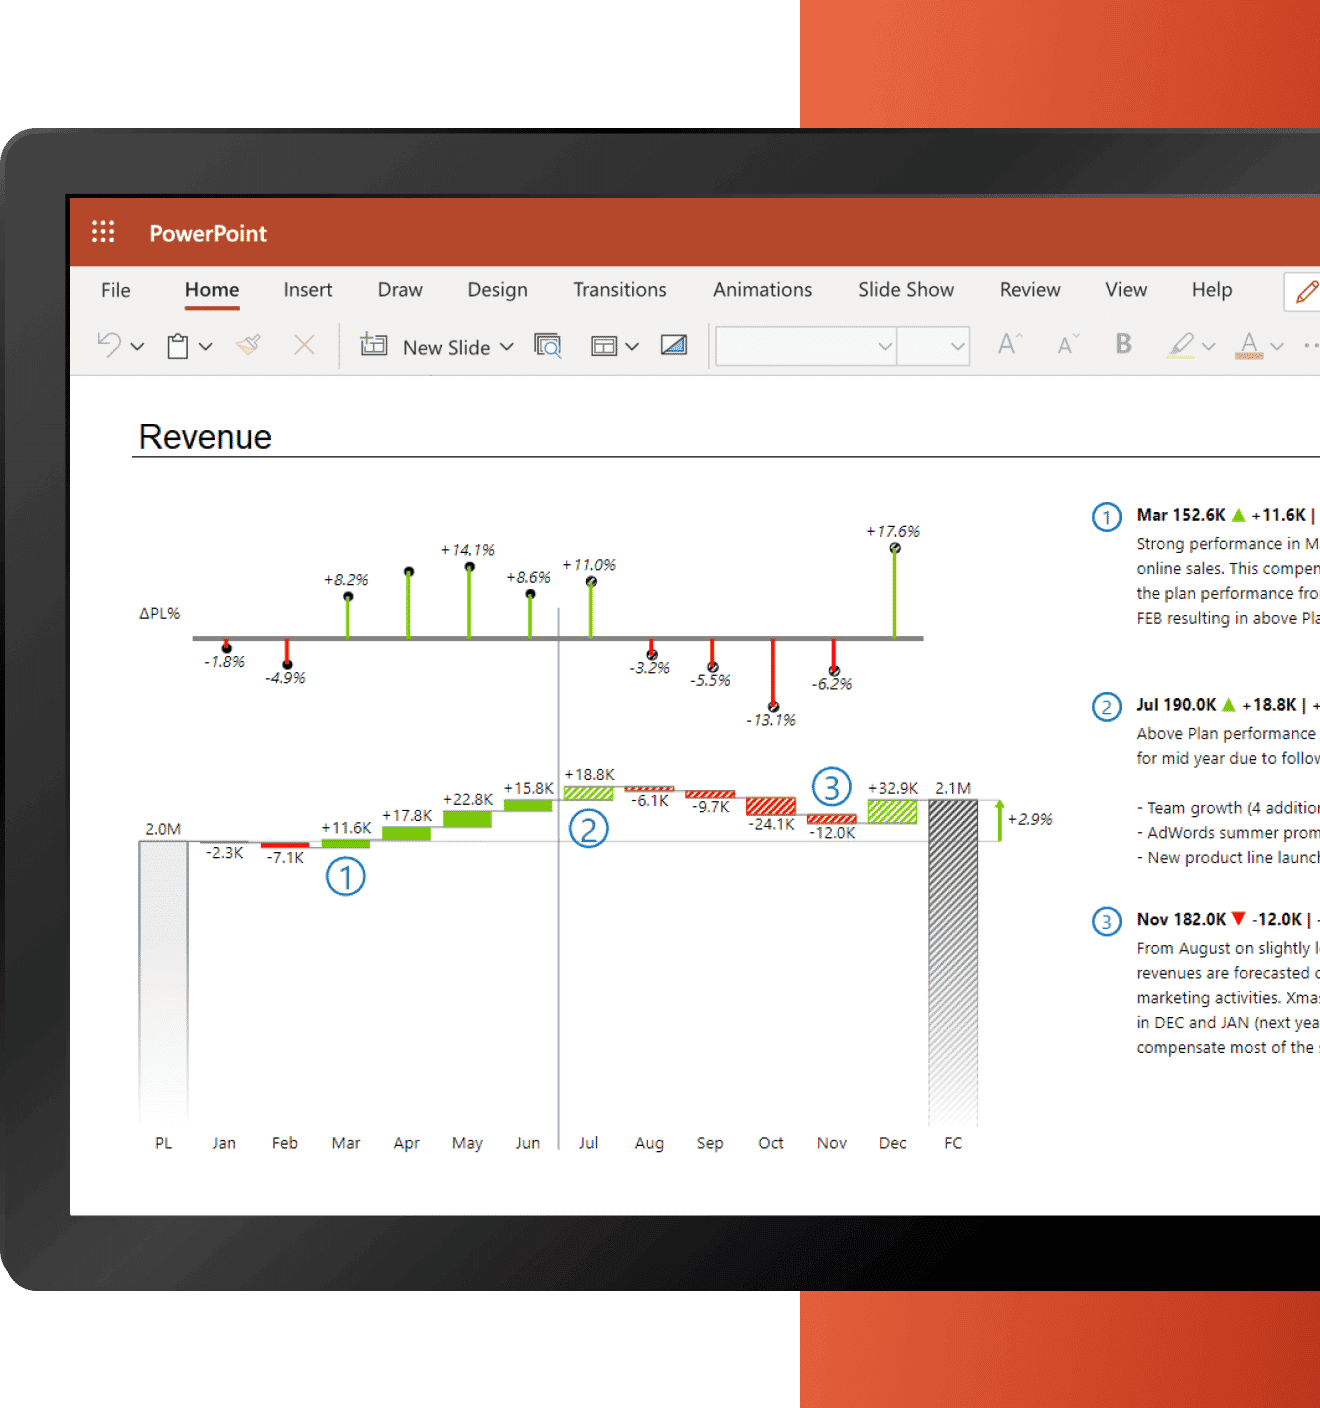
What's our sales performance compared to the plan? Which business categories are doing the best and where do we need to focus our attention? Are we spending more than last year and how much more? Ditch time-consuming analyses. With Zebra BI, you'll know answers immediately, because it will uncover business insights for you. 

Frequently asked questions

Which Office versions are supported?
We currently support Office 2021, Office365, and Office for Mac. Also, Office mobile apps are supported (when viewing, visuals are rendered as static images).
What does Zebra BI for Office include?
For more details and information please visit our knowledge base.
Learn more
Can I try Zebra BI for Office for free?
How does it look like when a developer creates a report and sends it to someone who does not have the Zebra BI visuals added in PowerPoint (report viewers)?
Report consistency
If you use the right charts and the same colors to show when something is bad and when something is good, it significantly shortens the time to understand the numbers. Zebra BI is fully compliant with International Business Communication Standards (IBCS) to make sure reports across your organization stay consistent and follow the same logic for easier understanding. 
Data security
We don't store your data. All we do is use it to render visuals in your PowerPoint. We're GDPR and CCPA compliant. And with 1,500,000+ users around the world and global brands such as Coca Cola, Nestlé, and bp as our customers, you can rely on Zebra BI as your reporting solution. 
Not another tool 
Regardless of what BI tools you're using within your organization, at the end of the day you need PowerPoint to tell your story. With Zebra BI you can create advanced visualizations right there inside your slides. Focus on actionable  business insights and have more productive meetings.  

Ready to see
Zebra BI for PowerPoint in action?

Import Zebra BI to your PowerPoint and watch the magic happen on your data! You can also contact us to help you build your first test report and create a custom package for your business.