Make your next report jaw-dropping with our free report templates. They're fully customizable, prepared according to the latest best practices, and easy to use. Get inspired!
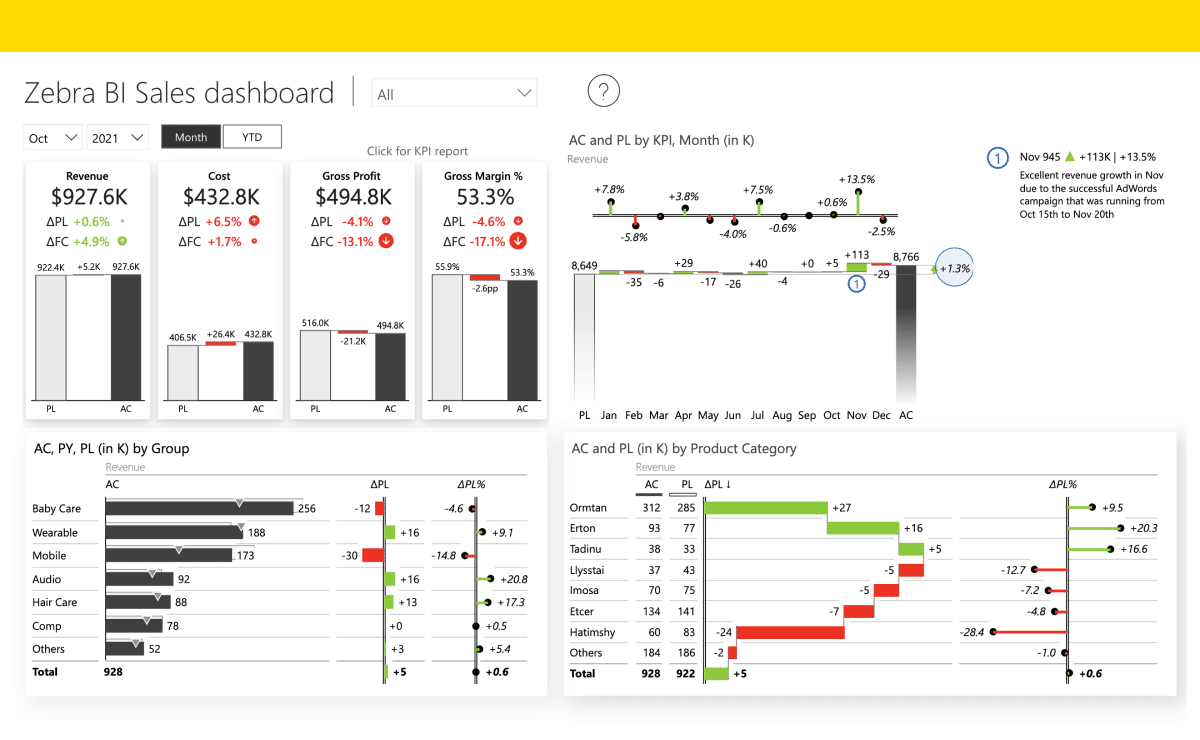
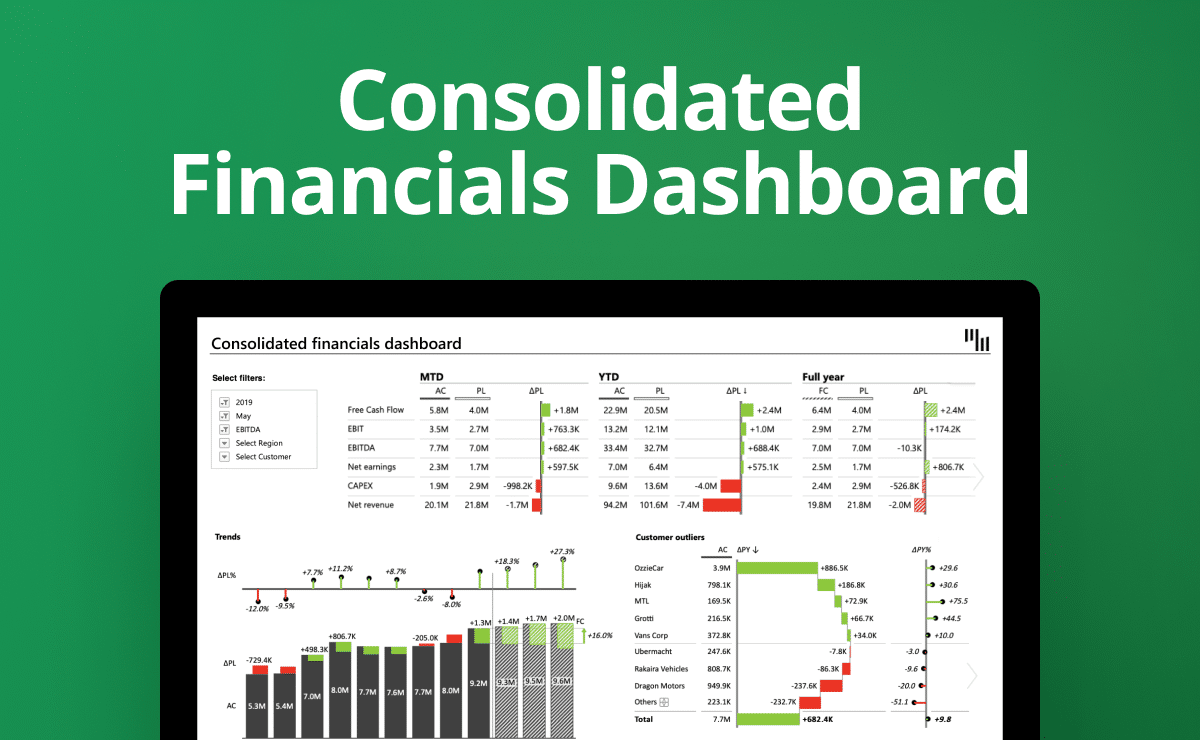
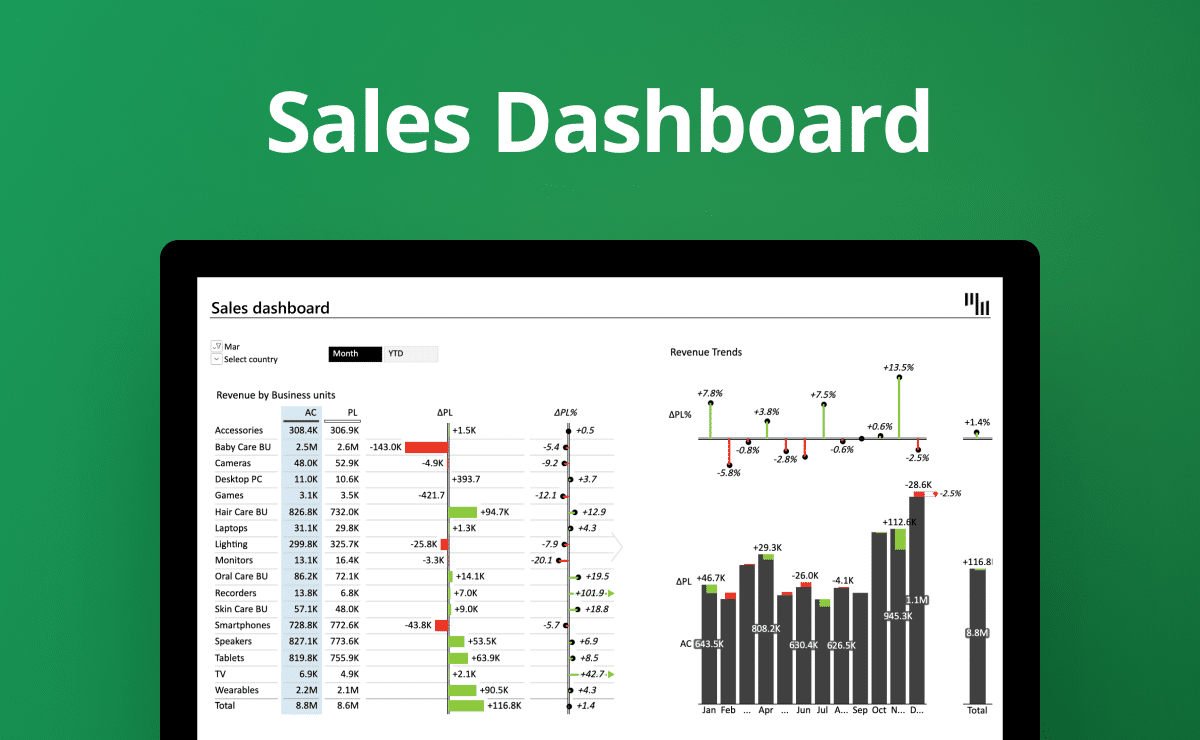
“Our financial landing page is completely based on the sales dashboard. We also use a copy of the consolidated financials. The templates of Zebra BI are providing us with a lot of inspiration, and we don't "need to invent the wheel" again !”
 September 8th
 February 22nd
 !”
!”