September 8th
 February 22nd
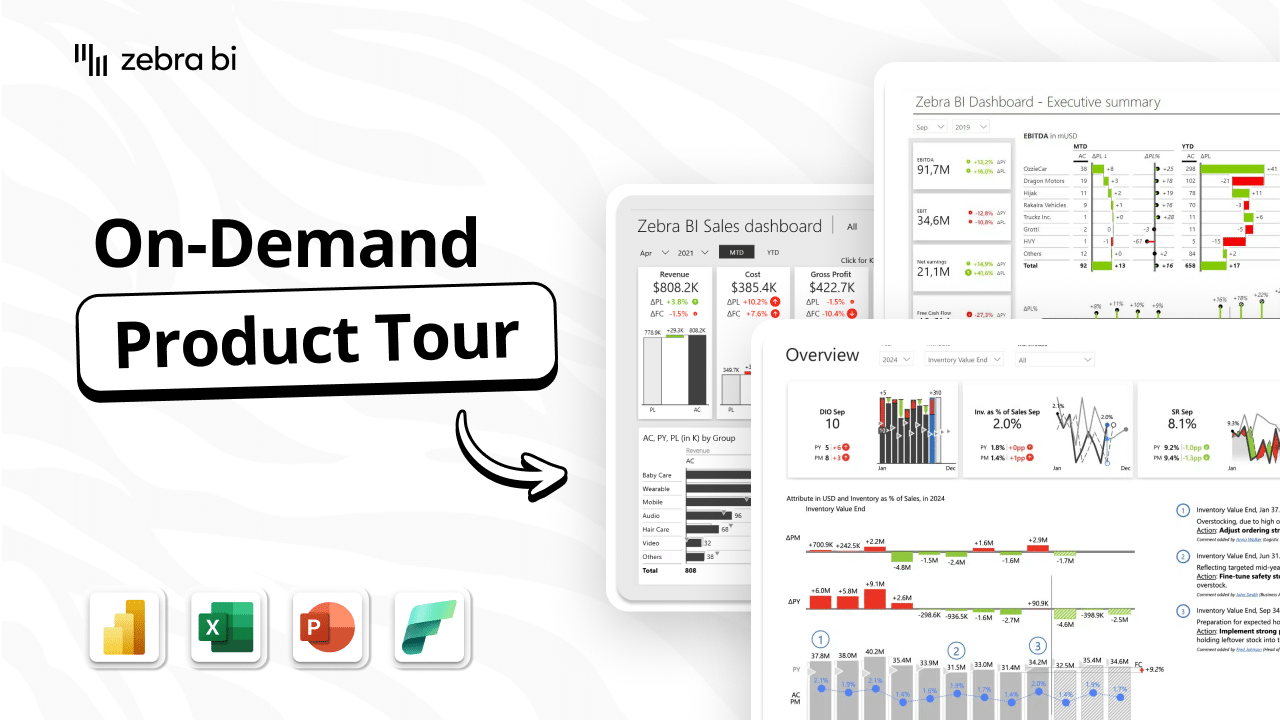
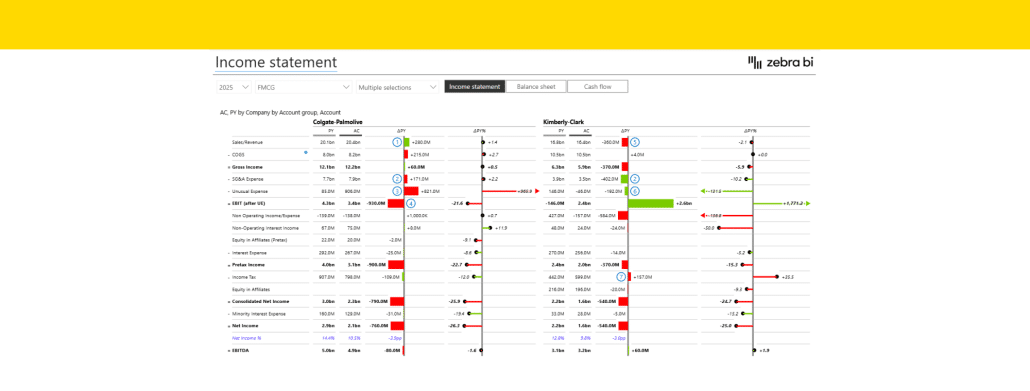
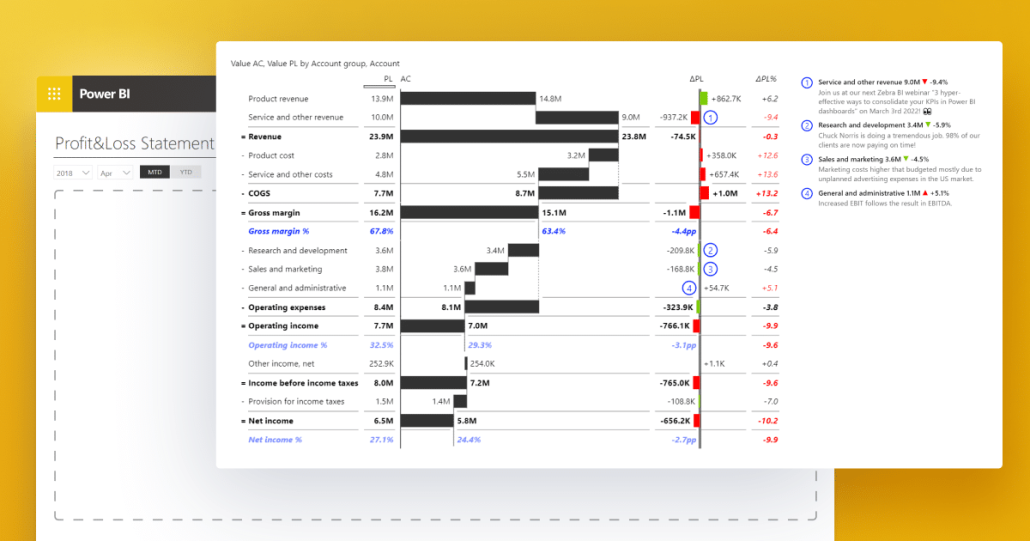
Watch the on-demand product tour and see how report structure and built-in visuals turn raw numbers into reports your leadership will actually act on. No setup, no sales call - just press play.
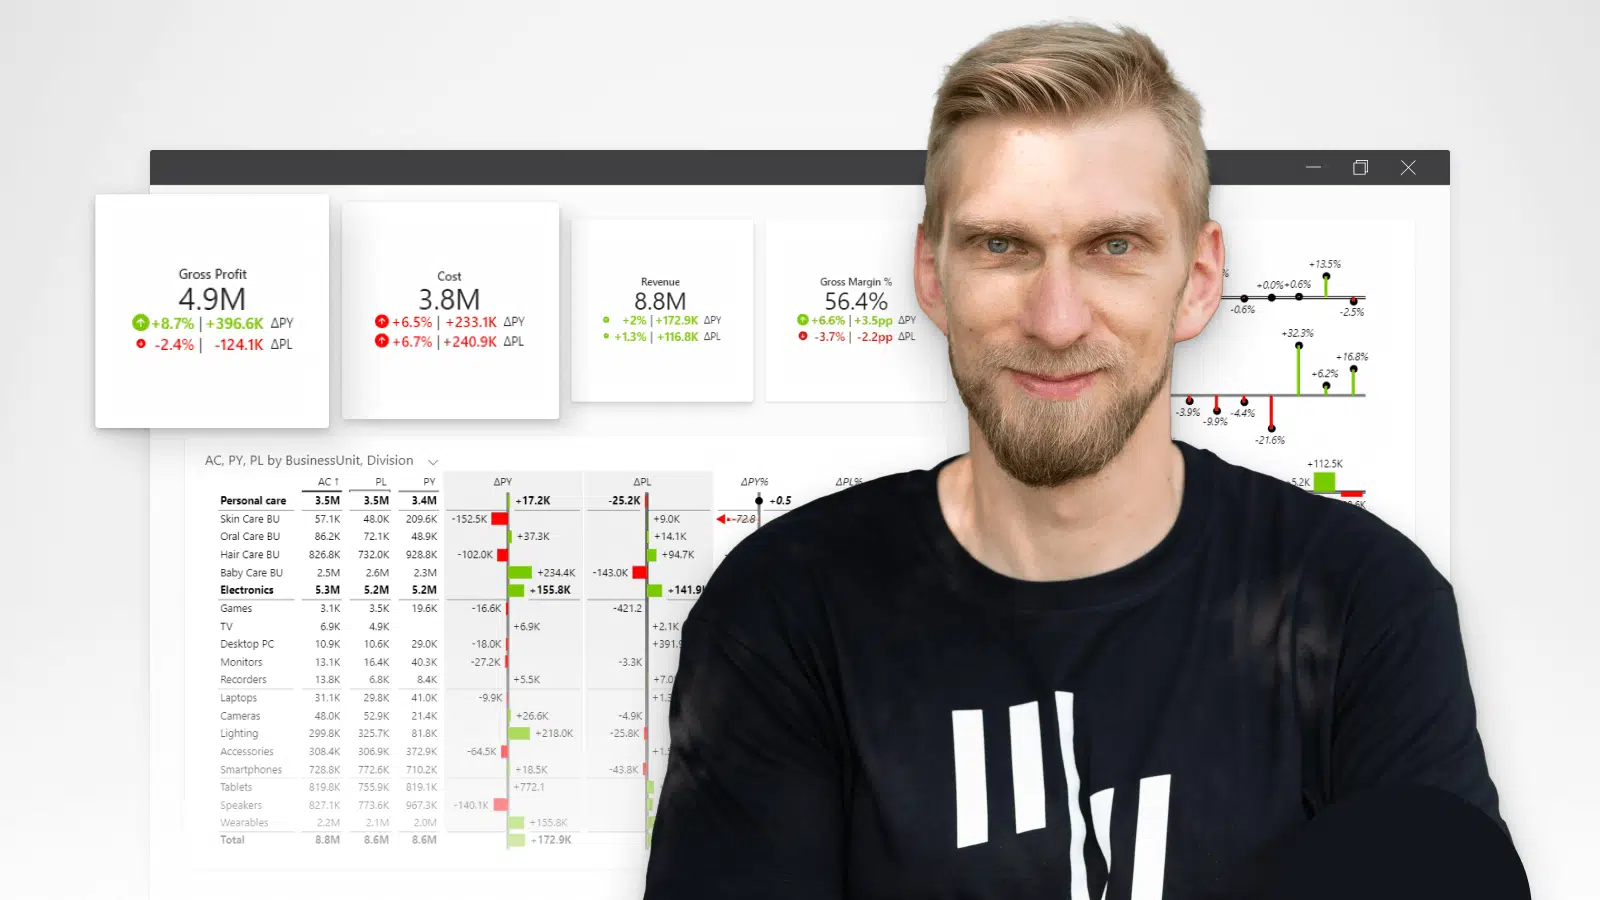
Join our BI expert Matej as he shows you how to build actionable reports with Zebra BI visuals from scratch.
It’s super simple – see for yourself.