Your reports are ready. Decisions aren't. What's still standing between data and action?
If your CFO still calls after reading the report, the gap with data isn't closed.
This session shows you how to close it: live build in Power BI, real client case from an independent consultant, and a framework your team can use next reporting cycle.
Presenter:
Marnix Jansen
Power BI Consultant, Minova | Microsoft Certified Trainer
Presenter:
Mark Leskovšek
BI Solutions Director, Zebra BI
Presenter:
Matej Gregorčič
Customer Success Team Lead, Zebra BI
Registration closes in:
00
days
00
hours
00
minutes
00
seconds
Zebra BI webinars have been attended by 10,000+ visitors!
., . - . (.)
Can't make it live? Register anyway. Replays included.
Trusted by BI leaders at top companies worldwide
50+
Expert Webinars
30K+
Professionals Trained
Free
On Demand Access
“Our financial landing page at KPN is completely based on the sales dashboard template. We don't need to invent the wheel again.”
Wilco Nagtzaam
Senior FP&A Controller
“Zebra BI is the best feature that has been created for Power BI. It makes designing reports easy.”
Brahim Chabane
BI Professional
“What a great audience, so much knowledge in one place. Watching Zebra BI videos was a game changer for me!”
Patrick Soehlke
Managing Director
You know why it fails. Now let's close it.
THE PROBLEM
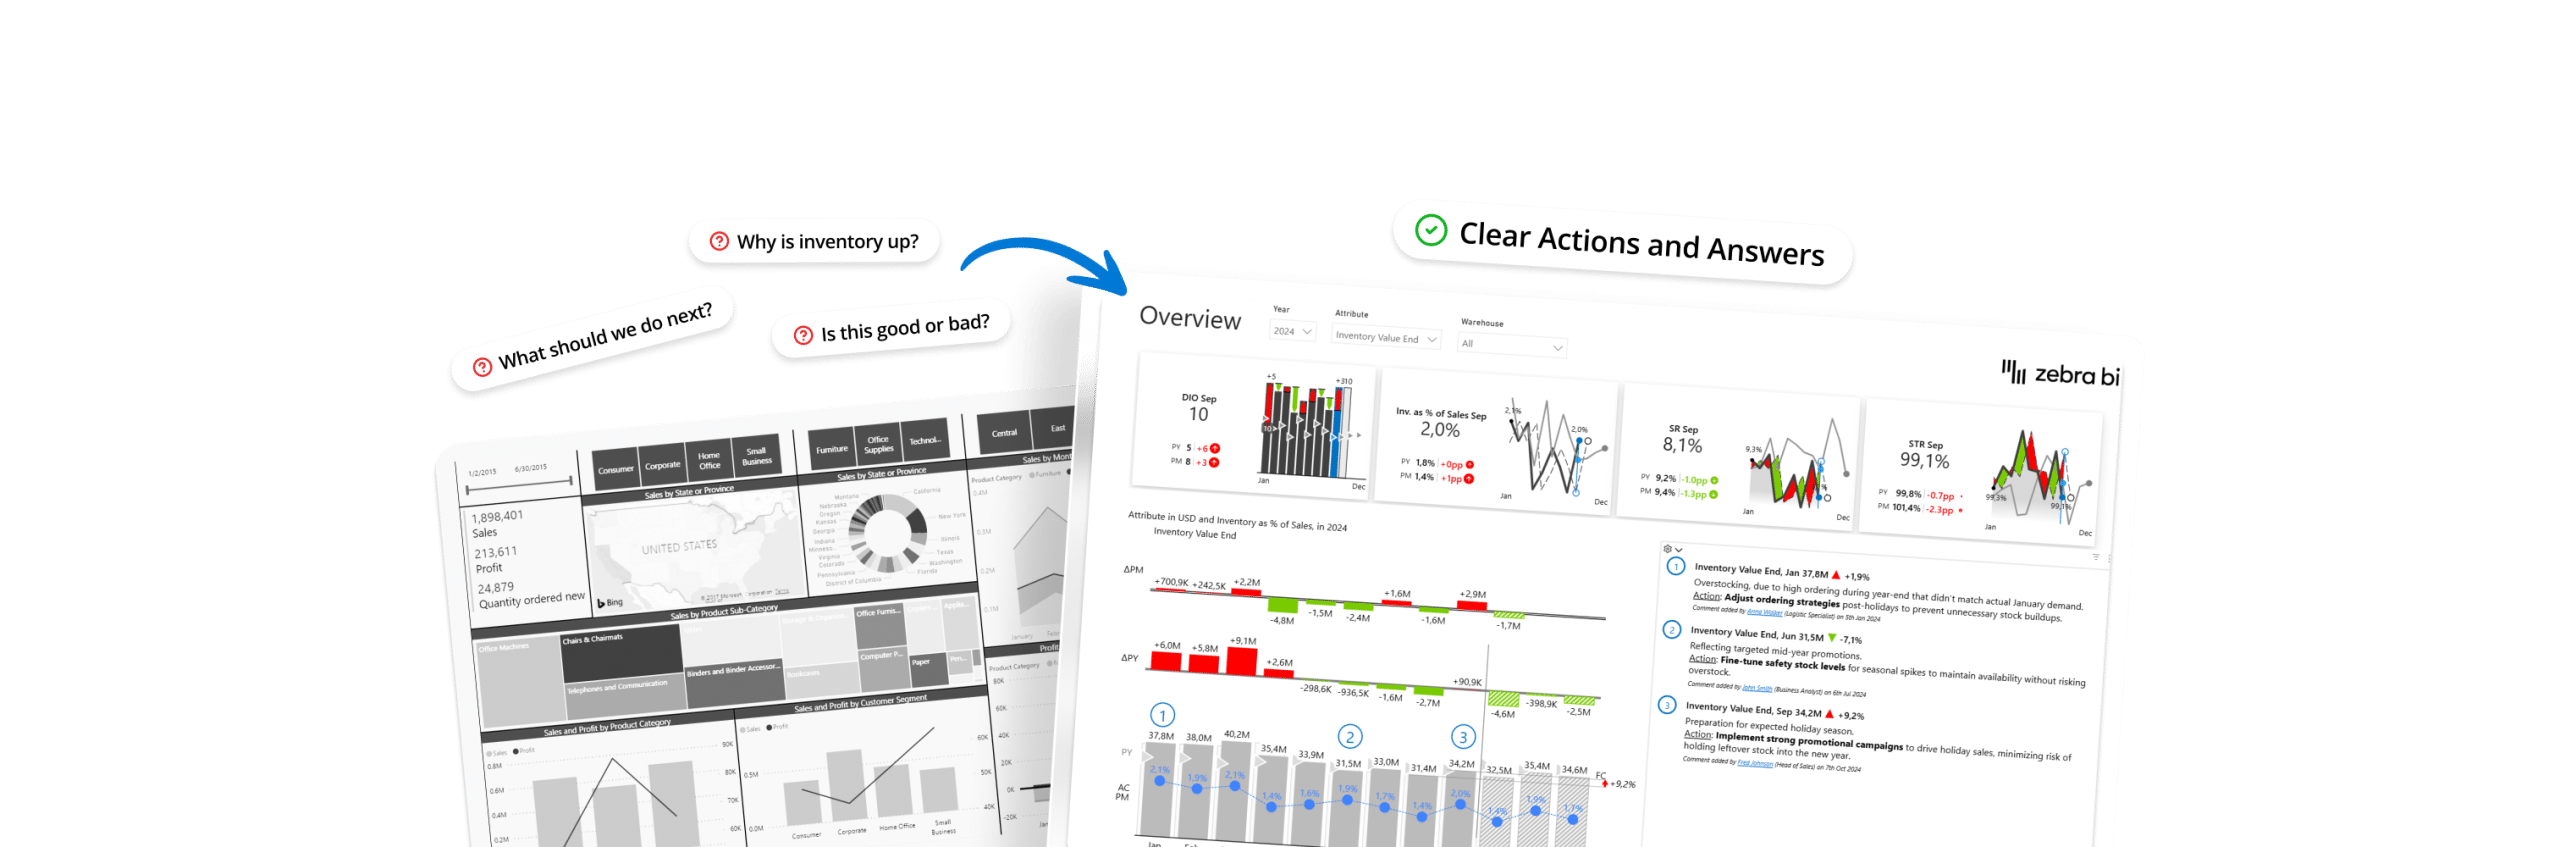
Part 1 showed you the pattern. Power BI is running. Dashboards are live. Data is clean. And decisions still happen in a PowerPoint someone emailed on Friday.
The diagnosis is done. Part 2 is where the fix starts.
Closing the Last Mile isn't about rebuilding your stack. It's about four things most reporting setups are missing.
Four things that separate a dashboard from a decision
Comparison
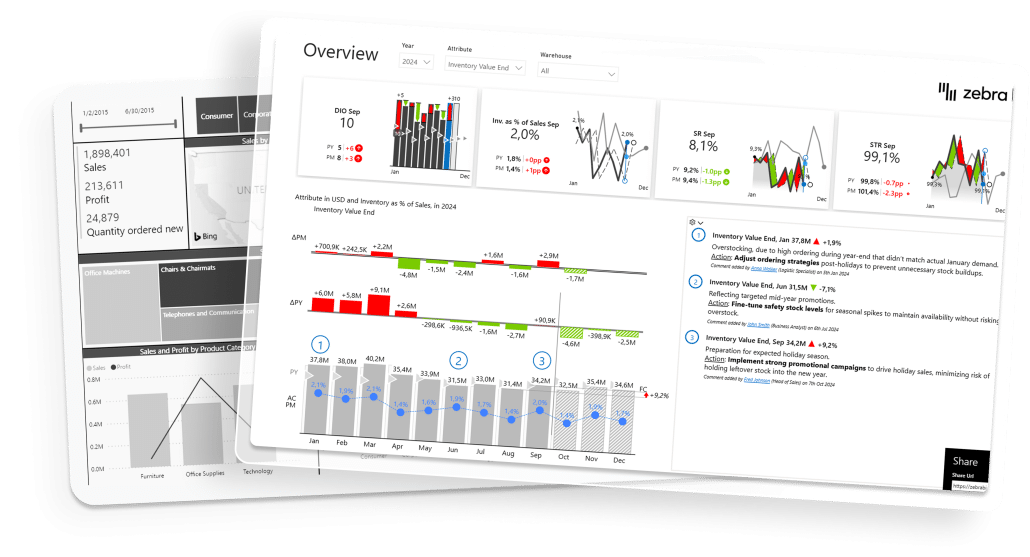
A dashboard shows a number. A decision needs to know if it's good or bad. Without automatic variance, the CFO sees revenue. Not that it's 12% below plan in DACH.
Focus
A dashboard shows everything. A decision needs what matters now. Without visual hierarchy, the signal sits in row 47 of a flat table.
Context
A dashboard shows what changed. A decision needs why. Without annotations, every report spawns a meeting to explain what the analyst already knows.
Direction
A dashboard explains the past. A decision needs what's next. Without a narrative layer, the next step lives in someone's head.
What decision-ready analytics looks like. Why standards like IBCS drive clarity, not aesthetics. Built live in Power BI with a real client case from an independent consultant.
Outcome: A practical model for action-driven analytics.
Part 3 • Apr. 23, 2026
How teams actually did It
Real examples from teams who closed the gap. What changed in behavior, not just reports.
Can’t make it? Register anyway - Replays included.
Who should watch this?
This webinar is for teams who already have BI but aren't seeing the impact they expected.
BI Developers & Analytics Leaders
You build great dashboards. Adoption is low. Change requests are constant. You're told to "drive more value" with no additional resources. This shows you what's missing.
Finance Leaders & Controllers
Your team spends days on monthly reporting cycles. You export dashboards to Excel to add commentary. You translate BI outputs into PowerPoint for executives. This is for you.
Senior Analysts & FP&A Teams
Your insights don't stick after meetings. Executives ask "what should we do?" after seeing your reports. Decisions lag despite clean data. You need this.
Power BI Teams Under Pressure
You're a bottleneck for every insight request. Self-service BI isn't working. You're doing everything the BI playbook says and it's still not enough. This framework helps.
So amazing, even Microsoft uses it for internal reporting.
Speakers
Marnix Jansen
Power BI Consultant, Minova | Microsoft Certified Trainer
Power BI Consultant, Minova | Microsoft Certified Trainer Marnix has been working with organizations on Power BI since the tool launched, helping companies turn complex business requirements into reporting that drives decisions.
Mark Leskovšek
BI Solutions Director, Zebra BI
Senior BI Consultant, Zebra BI | Mark has been deep in financial reporting standards and Power BI implementation for years, building the bridge between what finance teams need and what most dashboards deliver.
Matej Gregorčič
Customer Success Team Lead, Zebra BI
Customer Success Team Lead, Zebra BI | Matej has helped hundreds of teams redesign their reporting from the ground up, turning the same data into something people actually use to make decisions.
Why attend live?
You'll leave with:
A new lens to diagnose BI problems tools can't fix
A framework you can use with finance, BI, and IT immediately
Clear next steps to assess if you're stuck in the Last Mile
Ask questions. Get specific answers. Learn from peers.