 September 8th
 February 22nd
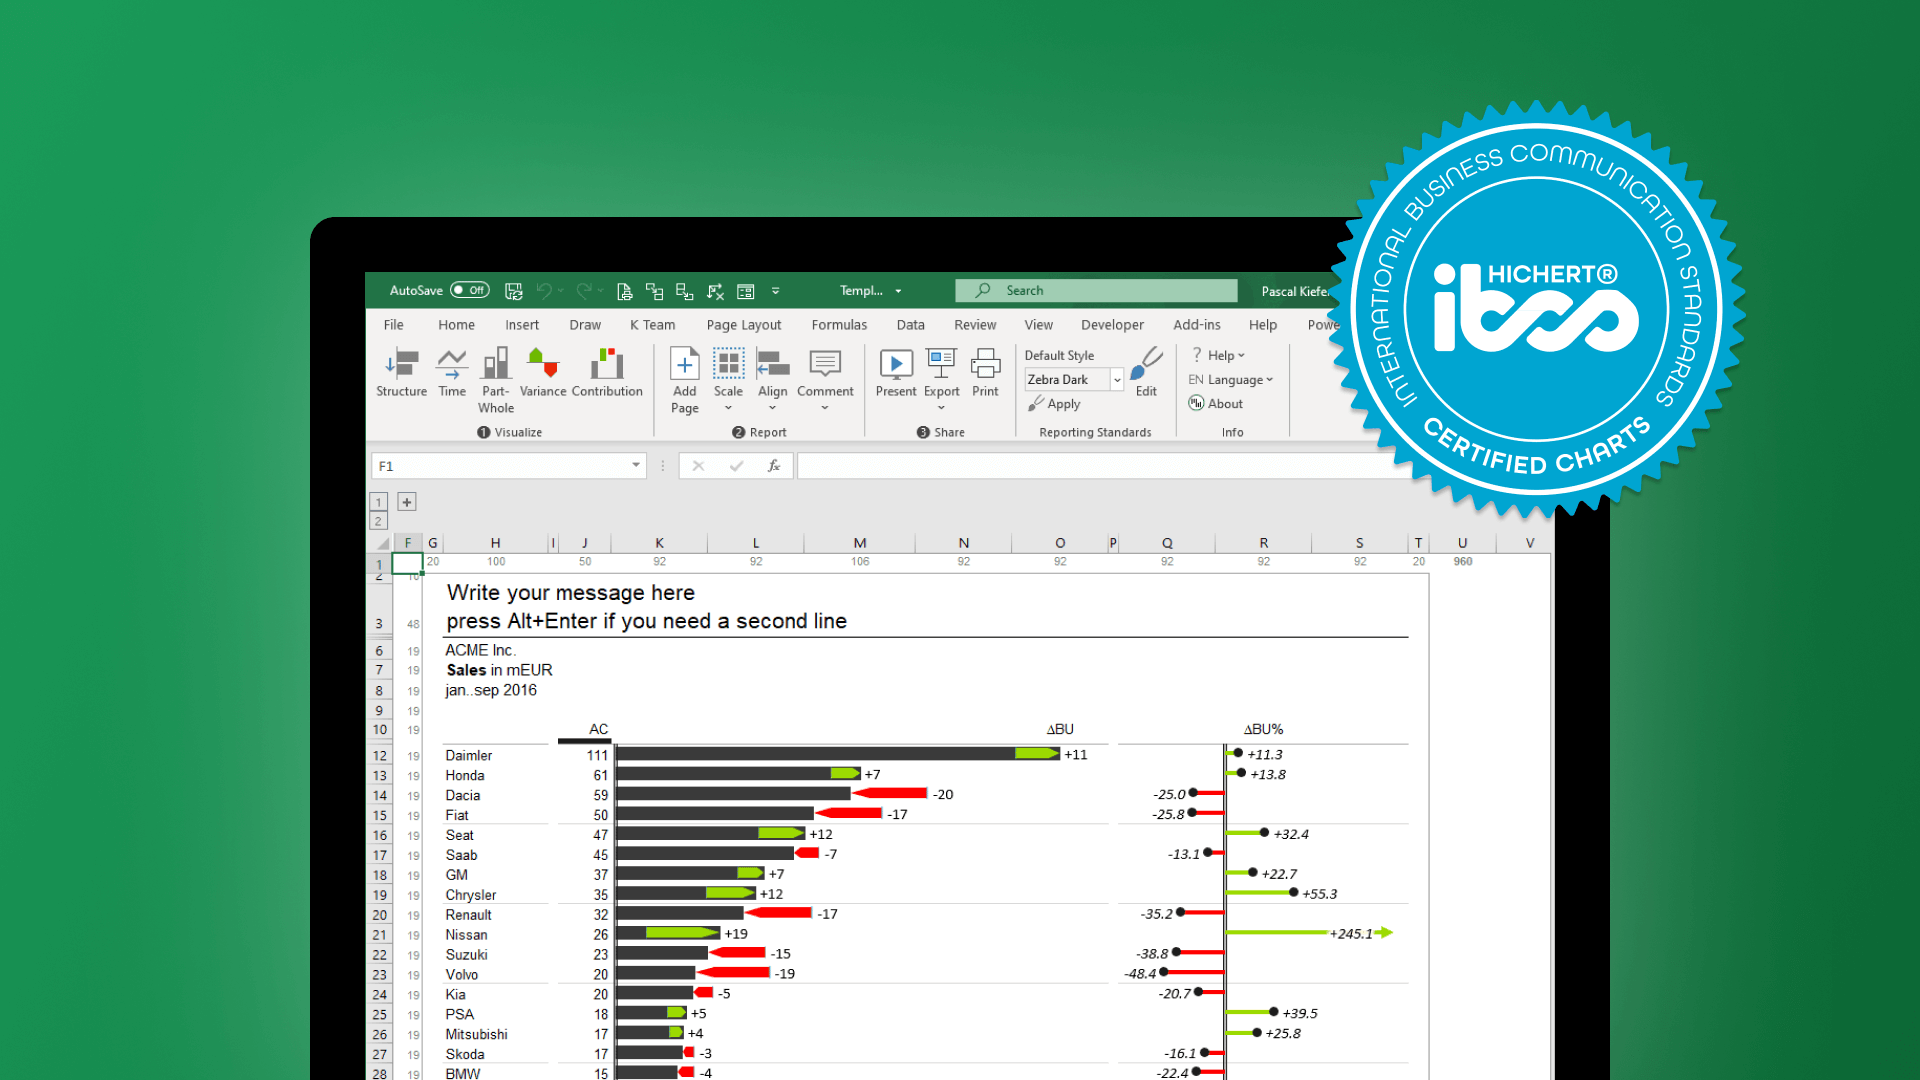
On June 8th, Zebra BI passed the IBCS certification process, becoming the first "IBCS certified charts + tables" software.
The certification commission from the Business Application Research Center (BARC) in Germany that issued the certificate was very impressed with what Zebra BI can do. Here is one of their comments:
The certification commission was impressed with Zebra BI. All templates matched the patterns provided by the certification commission almost identically.
Today the Zebra BI version 1.4.1 (that was used to pass the IBCS certification) is ready to be publicly released.
This version includes many new features. Read on to get detailed information about each of them.
Page templates
If you work in reporting and analysis (or any other similar field) you have to create the same types of reports over and over again. To make it easier for you to do that, we added the "Add Page" feature.
Now you just have to design a blank report template and when you add it using the "Add Page" feature, it will be inserted as a new worksheet into your current Excel file.
For your convenience, Zebra BI version 1.4.1 comes with several report templates included.
All included templates are designed so that they fit pixel-perfect to a PowerPoint slide.
Install the latest version, click on "Add Page" and choose one of the pre-installed templates from the "My Documents/My Zebra BI/Templates" folder.
This feature is especially useful for large companies and enterprises. You simply design your own report templates and share them with all the employees. Now everybody can create the same standardized reports.
Here's an example of how you can use one of the templates to create an IBCS compliant report in 2 minutes (this video is actually the Zebra BI elevator pitch from the recent IBCS conference. Sorry for the video quality :)).
Limiting the outliers in plus-minus variance charts
In the real world, the data is usually not evenly distributed. It tends to follow the Pareto principle where, for example, 20% of your products are responsible for 80% of your total sales, while the other 80% of your products amount for just 20% of sales.
This problem is even more common when you deal with relative variances on the plus-minus dot charts. The products with lower total sales tend to have much larger relative variances than those with high total sales.
With Zebra BI version 1.4.1 you can solve this problem by limiting the outliers. You simply input your desired max and/or min limit so that every value that exceeds those limits gets cut off at the limit and displayed with an arrow instead. See this animated gif for a visual representation of this feature.
New Zebra BI Comment section
Expanded "Comment" section
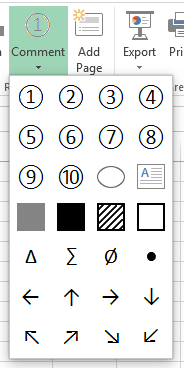
The "Comment" section of the Zebra BI ribbon has been significantly expanded. The new additions include:
- The ellipse for highlighting important values
- The shortcut for adding comment text-boxes
- The four IBCS "scenario markers" for table columns
- Four commonly used symbols (delta, sum, average and dot)
- Eight arrow symbols for indicating trends
Other improvements
There are also some other improvements, including:
- The ability to move the legend from right to left in part-whole charts
- The Croatian translation. If you're a Croatian-speaking user, you can change your interface language in Info > Language in the Zebra BI ribbon.
- Several bug fixes
Download Zebra BI and try the new features yourself.