 September 8th
 February 22nd
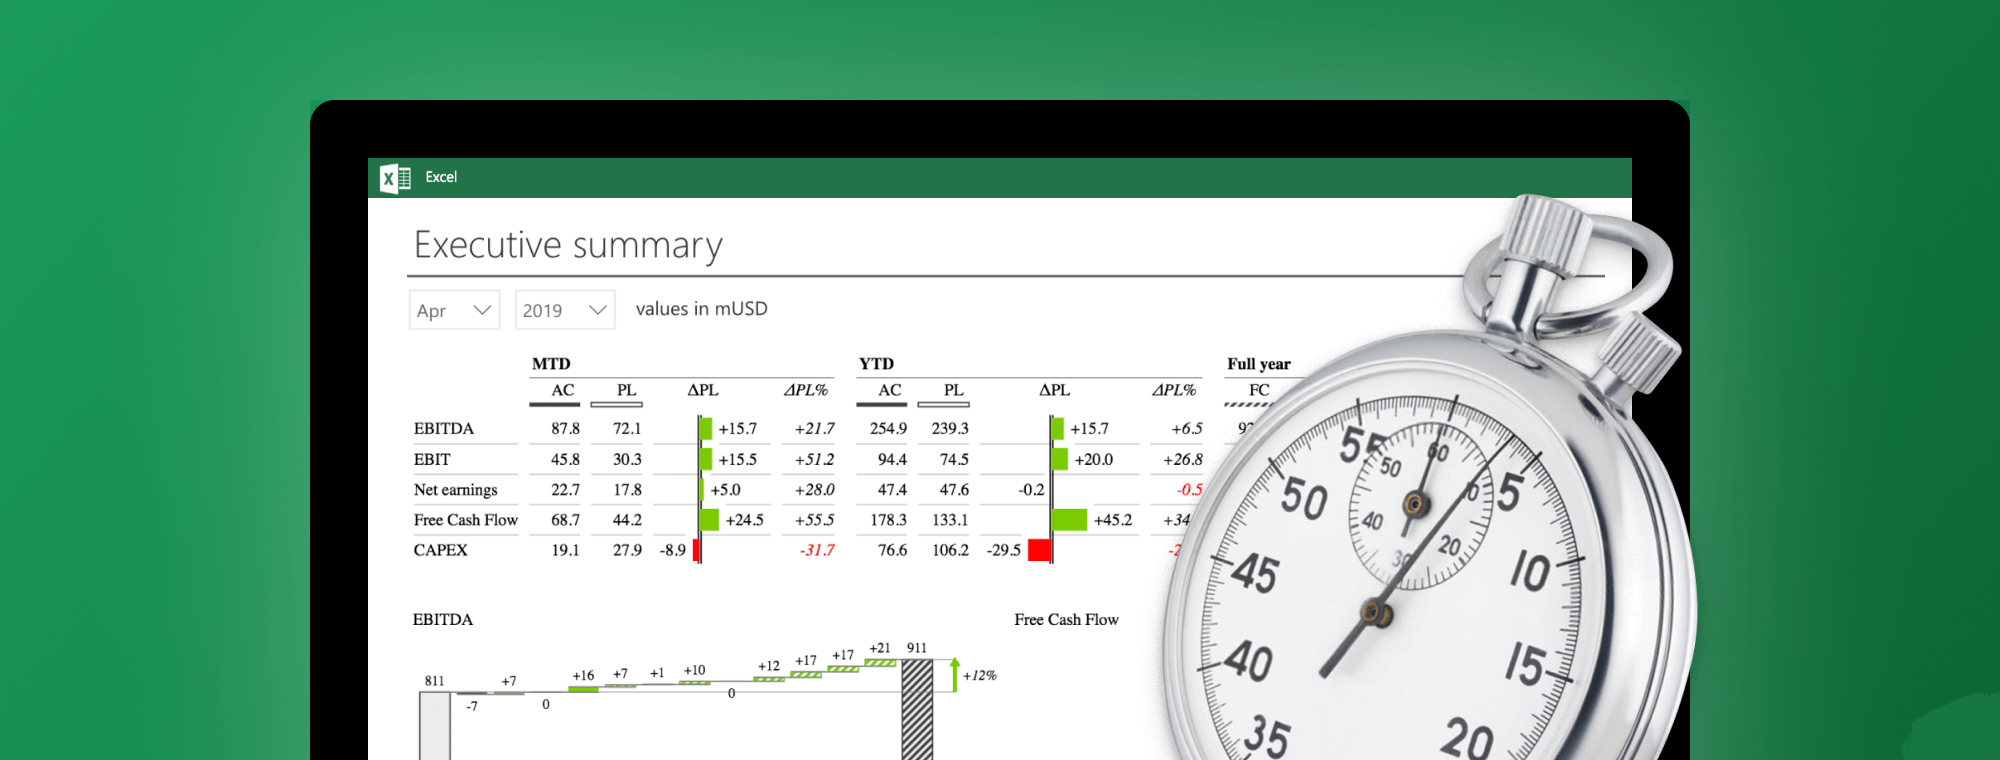
Can you learn best practice reporting in 15 minutes?
Yes, you can! Zebra BI now guides you through visualization and reporting best practices with a nice interactive tutorial.
Watch the video below to see how Zebra BI teaches you how to create awesome visualizations, reports, dashboards and presentations directly within Excel:
As you see, good reporting is not just about good charts. It's good charts + efficient labelling, correct scaling, using multiple charts, combining graphs into tables and above all, standardizing shapes and colors.
To learn these best practices yourself, click on the button below to download Zebra BI: