A brand new Zebra BI for Office is released! We will continue to support Zebra BI Add-in for Excel for a while longer, but all the game-changing features will be added to the new version. Be free to try it on your own data.
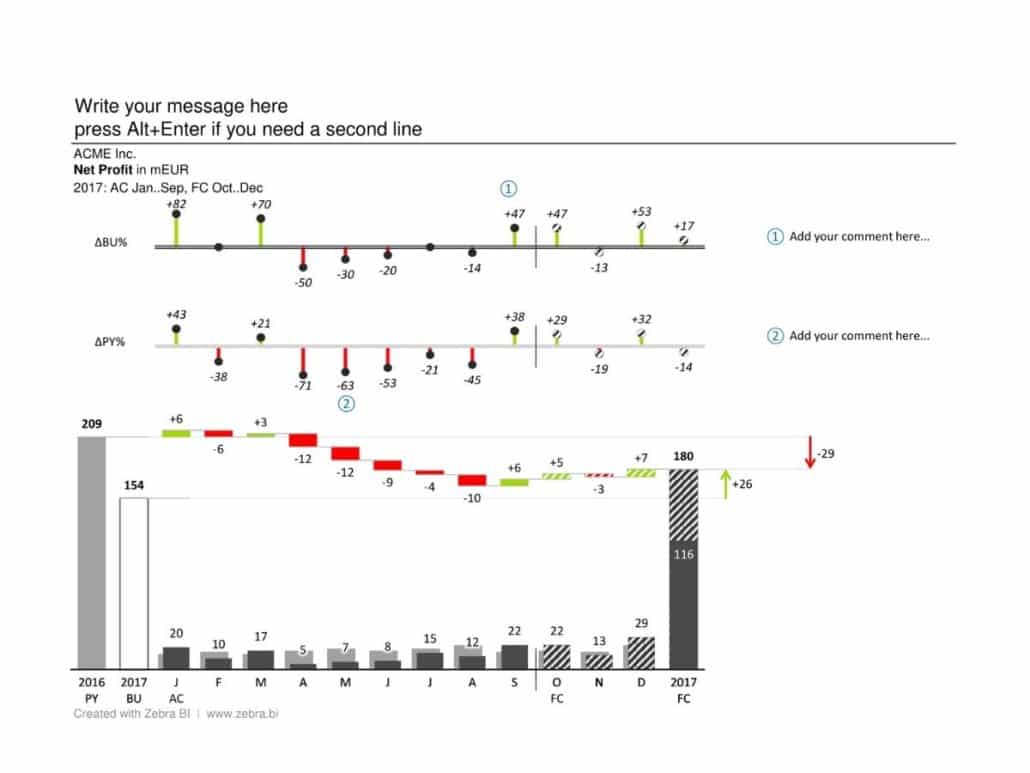
This advanced Excel template visualizes monthly data for all 4 business scenarios: AC, PY, BU and FC. It displays absolute variances using a waterfall chart and also relative variances using lollipop charts.
 September 8th
 February 22nd