Turn raw data into boardroom-ready reports

The #1 Power BI visual
Zebra BI gives Power BI the advanced charts, tables, and KPIs your business actually needs - out of the box.
Used by companies such as:

Fill out the form and get started

4.9

Zebra BI Visuals are #1 Reviewed Add-In For Financial and Sales Dashboards. 

Used by thousands of business analysts around the world. Get Zebra BI Charts, Tables and Cards directly from the Microsoft AppSource.
One visual. Many visualizations.

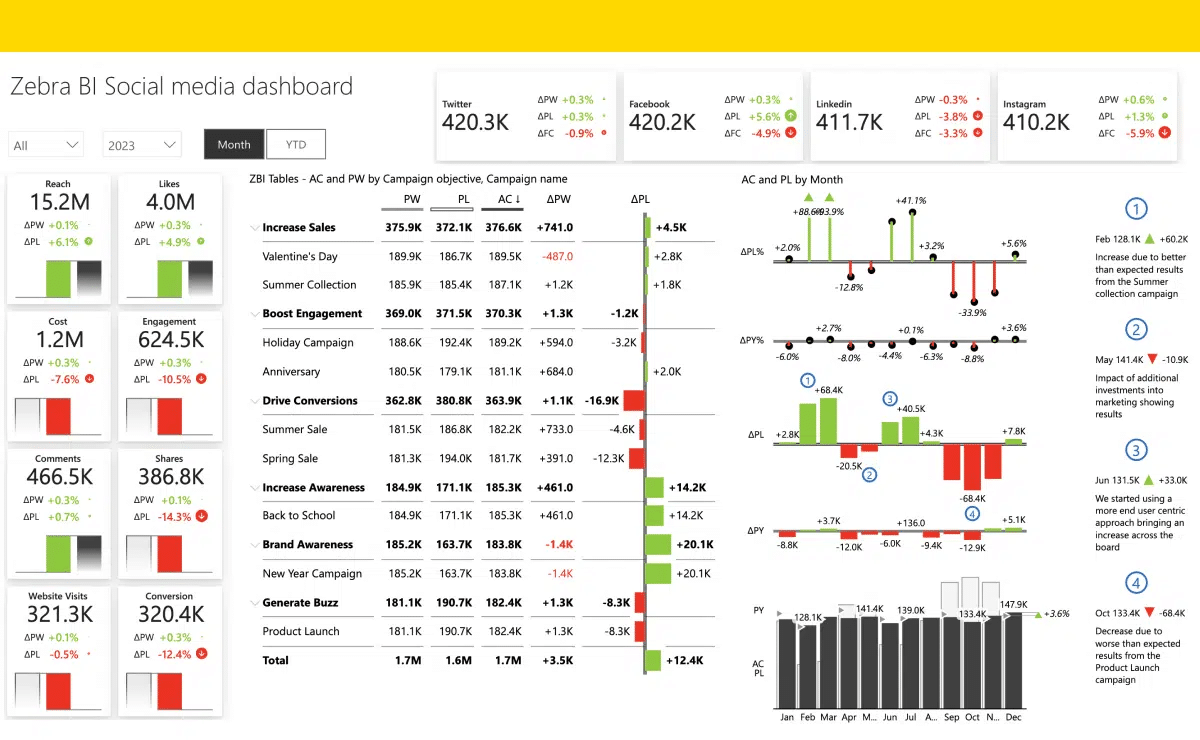
Create advanced reports in a single visual

Build any report you want - from sales dashboards to financial statements - all inside Power BI. Format tables, charts, and cards exactly how you need them.
More chart types. Better insights.

Switch between visualization elements

Stacked, Combo, Waterfall, Segmented - pick the chart that tells your story best and switch instantly, no rebuilding required.
Instant context

Calculate comparisons out-of-the-box

Zebra BI automatically calculates absolute and relative variances for you - so you always know exactly where performance stands.
Get Started Now
Annotations made effortless.

Add comments directly to your reports

Use dynamic comment markers and comment boxes to display notes right inside your charts, tables, and cards - no extra tools needed.

Report consistency

We don't store your data. All we do is use it to render visuals in your Excel. We're GDPR and CCPA-compliant.

Data security

quick comprehension of numbers by using the right charts and colors, following IBCS standards for consistent reports.

 BI consolidation

With Zebra BI you get advanced Power BI feature, complementing your existing BI tools and leveraging the power of millions of Excel users.
Custom calculations. Zero complexity.

Calculate new measures with Formula Editor

Need a new element in your table? Just calculate it on the fly - no data set changes, no extra work.
Every screen. Perfect fit.

Adapt information density with responsive layout

Zebra BI visuals automatically adjust the amount of information shown to fit any screen size - no manual tweaking required.
All your KPIs. Zero clutter.

Add multiple KPIs within one visual

Transform your scorecard with Zebra BI Cards - add unlimited KPIs, speed up report loading, and drill through to detailed charts and tables instantly.
Get Started Now
Make every report on-brand.

Style your dashboards for best clarity

From advanced highlighting to company-wide custom themes -design stunning, IBCS-compliant reports that look exactly the way you want.
visual styling zebra bi power bi
The smartest way to compare data.

Supercharge reports with Small Multiples

Build multiple charts in seconds, perfectly scaled and ready to compare - the most advanced Small Multiples in any BI tool.
Beyond native Power BI tooltips.

Create even the most advanced reports

Zebra BI tooltips show extra dimensions and details native Power BI can't - plus Top N + Others to highlight only your most impactful categories.
Real results

Built for teams who take reporting seriously

Over 1 million Zebra BI users trust us worldwide.
“With Zebra BI, we standardized reporting across teams and saved the equivalent of 1–2 full-time analysts per year.”
Problem
Time recovered from formatting and manual assembly, redirected to analysis andbusiness partnering.
Result
Decisions on pricing, headcount, and strategy happen in the time available — not deferred to the next cycle.
"There should we isn't just symbolic upgrades - they deliver a lot the right story faster and better."
Problem
Time recovered from formatting and manual assembly, redirected to analysis andbusiness partnering.
Result
Decisions on pricing, headcount, and strategy happen in the time available — not deferred to the next cycle.
+46%
increase in speed analysis
+61%
improvement in decision accuracy
50%
less time spent on reporting
4.8
user rating in Microsoft Appsource
Check out all use cases →
Simple, transparent pricing

Pick the plan that fits your team

View full pricing page →

Zebra BI ROI Calculator

Companies that use Zebra BI spend less time on data visualization and make faster and better business decisions.

Enter your values to see how much you could save.

Your estimated annual saving on report building and increased profit from business decision making is:
$606,200
Savings on BI dev time building reports
$400,200
Increase in profit due to improved decision making
$206,000
This is your estimated annual savings on the most tangible benefits of Zebra BI. Zebra BI customers experience additional benefits including revenue growth and churn reduction.
Contact our sales team to receive a comprehensive ROI estimate.
Try Zebra BI for Free
MORE THAN 1.500,000 EXPERTS USE OUR PRODUCT DAILY

Don't take our word for it

This a highly professional product. Our company’s leadership (finance and operations) is already asking we roll this out to all our PBI financial reports
This tool is unique. Most tools only show us WHAT happened. Zebra BI answers WHY it happened.
Our controllers now spend less time preparing comprehensive reports and more time analyzing data and crystallizing the message.
Frequently Asked Questions

Any further questions?

Once the 30-day period ends, you will have two options: purchase a license to continue using the full feature set, or seamlessly revert to the limited Free version of Zebra BI. Your existing visuals created during the trial will remain functional, though advanced features will be restricted.

Yes. Your 30-day trial grants you access to the full, unrestricted feature set for all three Zebra BI visuals in Power BI: Tables, Charts, and Cards.

No. The license key simply removes the feature restrictions on the visuals. It will not interfere with your existing visuals created under the Free version. All your current reports will function normally and gain the advanced features upon activation.

No. We do not require a credit card to start the trial. You will only need payment information if you decide to purchase a license to continue with the full feature set.

Immediately after submitting the form, you will receive a license key. This key grants you 30 days of full access across all three Zebra BI visuals (Tables, Charts, and Cards). Insert the key directly into the visuals to activate the complete feature set.

Your next report should be your best one

Insert Zebra BI into your Power BI and see the magic in your data happen!
Try Zebra BI for free