To facilitate and manage the distribution of Zebra BI visuals to report designers in your organization, you can add Zebra BI visuals as Organization visuals. This will eliminate the hassle of distributing the right version of .pbiviz files to report designers. Instead, you will upload the latest versions to your Organization store and they will be immediately available to all authorized users across your organization.
PLEASE NOTE THAT EXPORTING TO .PDF AND .PPT WILL NOT WORK FOR ORGANIZATIONAL VISUALS. PLEASE READ MORE ABOUT THEIR LIMITATIONS HERE.
Upload Zebra BI visuals to Organization store
If you are a Power BI administrator, you can upload and promote custom visuals as Organization visuals. Here are the step-by-step instructions:
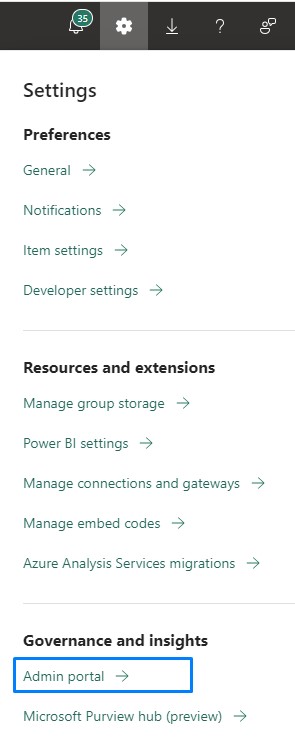
1. Open the Admin portal under Settings:
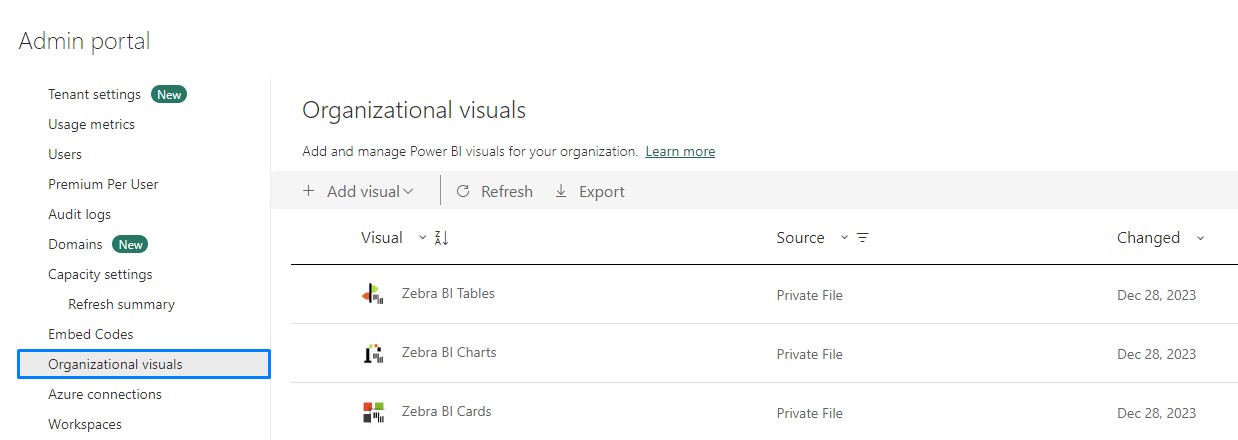
2. In the Admin portal, select Organization visuals and click on Add visual where you get two options, From a file or From AppSource.
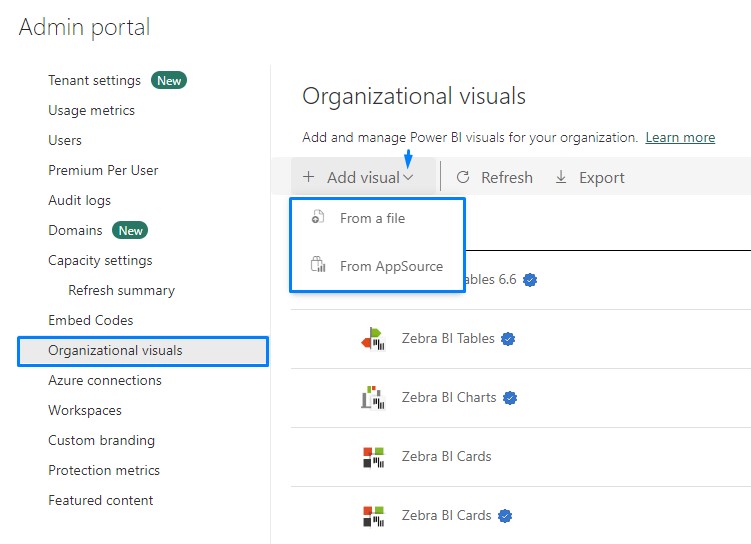
2. If you select From a file an additional window opens where a browse option appears which allows you to import a .pbiviz file. When you’re done, click Add to store the visual as an Organizational visual:
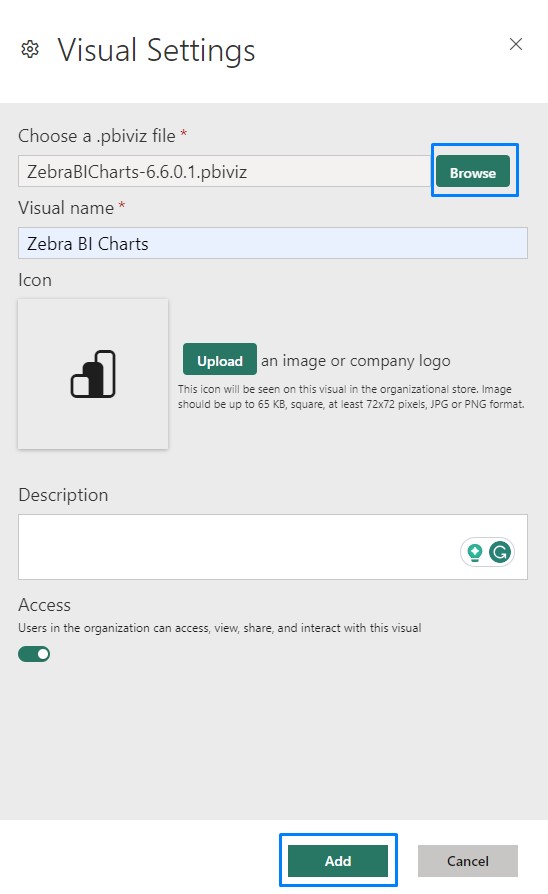
Here is the information you can use when editing the details:
Zebra BI Charts
Icon:
Description:
Zebra BI Charts features charts with a horizontal axis, such as column charts, line charts, waterfall charts, variance charts, ‘hills&valleys’, and many other types of advanced charts.
Zebra BI Tables
Icon:
Description:
Zebra BI Tables is the most powerful table/matrix visual in Power BI and features charts with a vertical axis and various table-chart combinations.
Zebra BI Cards
Icon:
Description:
Zebra BI Cards visual enables you to present a complete overview of the most important KPIs in one click.
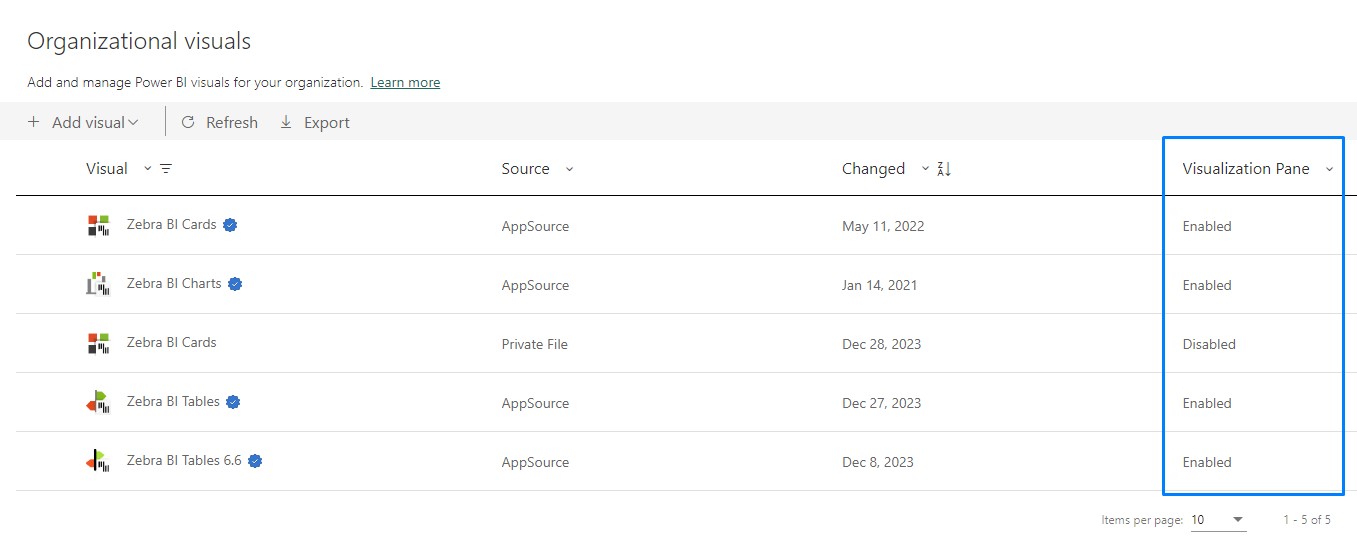
After you’re done, you’ll get all visuals listed under Organizational visuals:
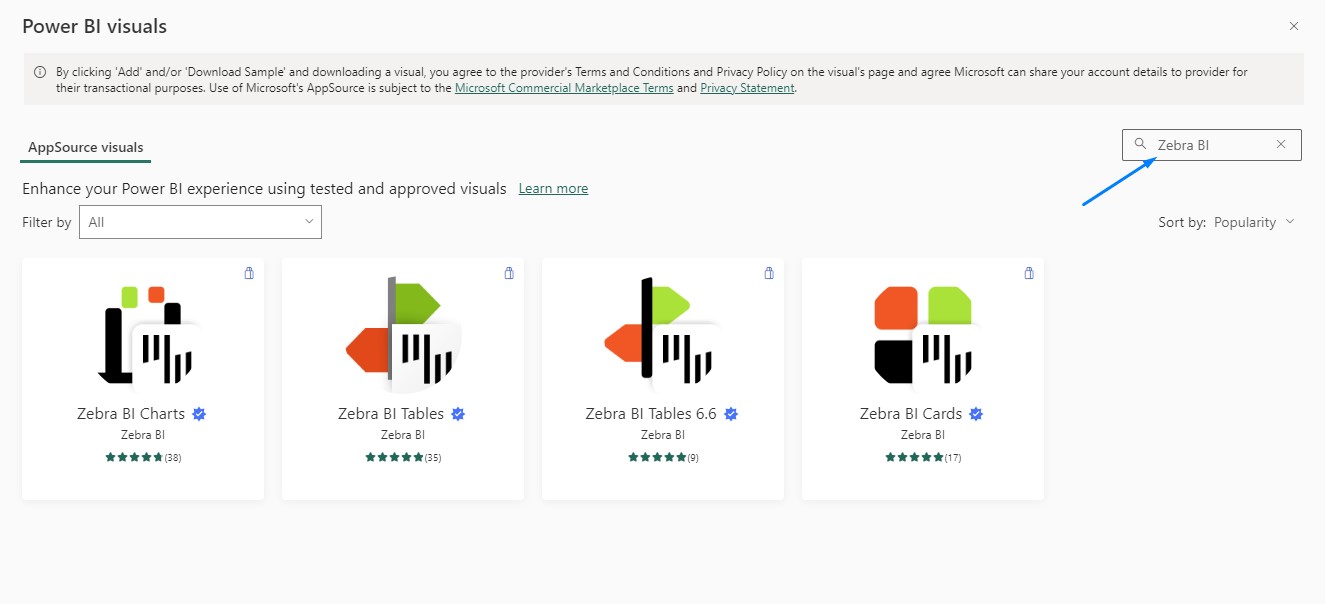
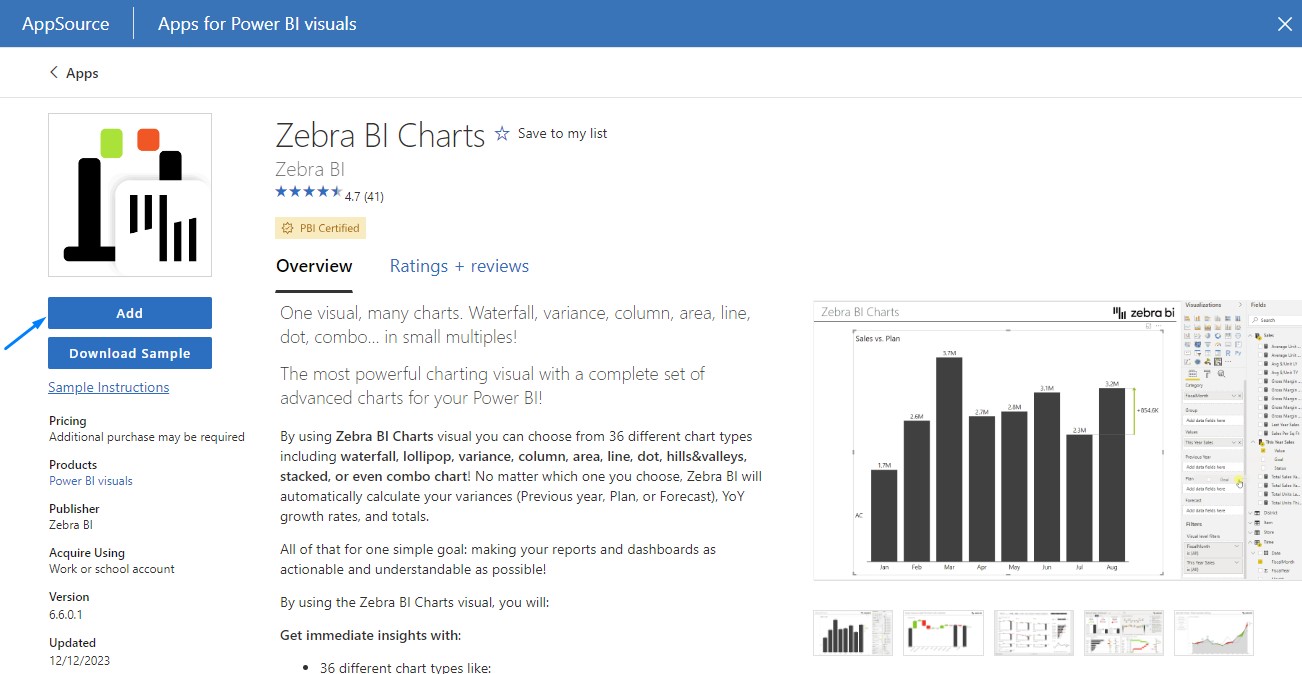
3. The second option is adding a visual directly from the AppSource store. When you select From AppSource the pop-up window redirects you to the AppSource store where you browse for Zebra BI and add a visual.
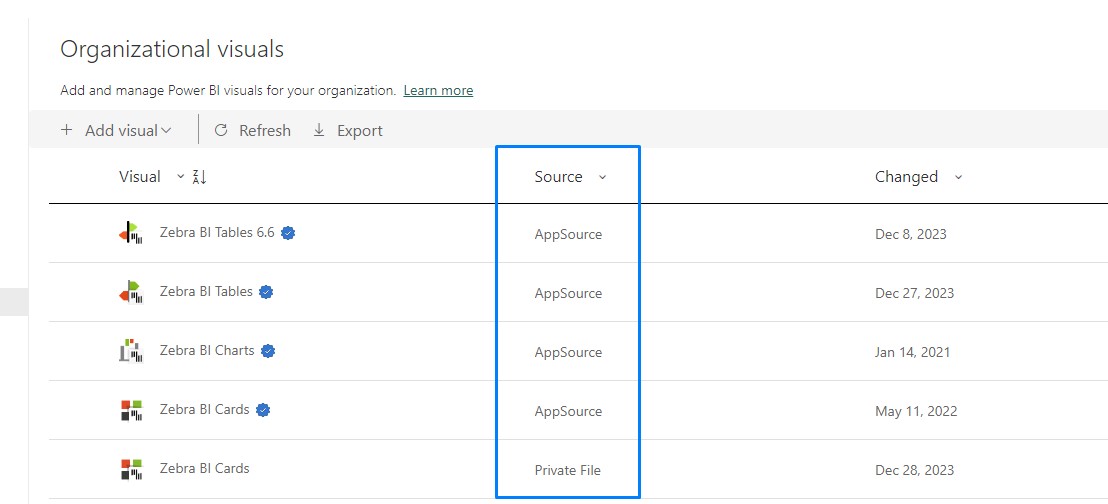
You can distinguish the AppSource versions from the file versions by the Source type
Adding visuals from the Organization store to your reports
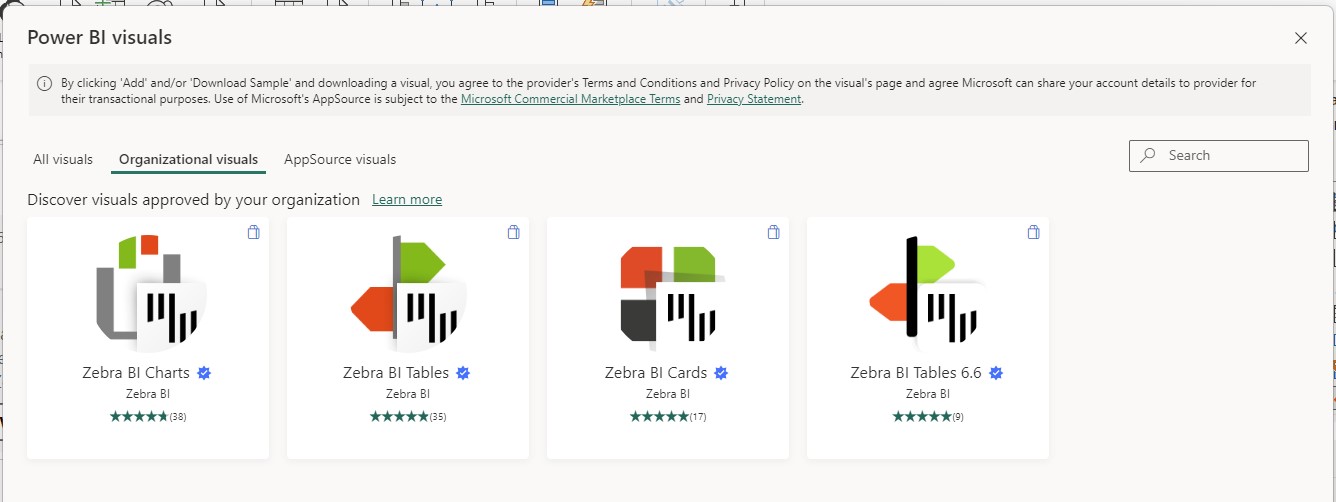
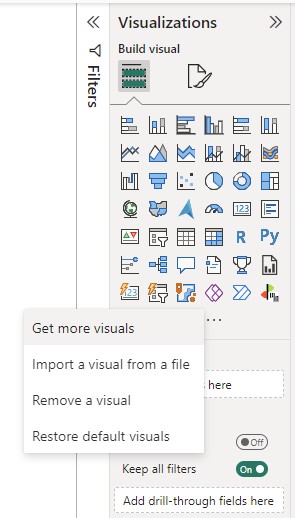
Once the visuals are added as Organizational visuals, the users can add them to their Power BI reports by clicking the ellipsis (…) and selecting Get more visuals:
In the pop-up window, click Organizational Visuals and choose the visual to add to your report:

As an Administrator, you have an option to Disable/Enable visuals directly in the Visualization Pane, which means the visuals that have been Enabled will appear in the Visualization Pane without needing to add them manually from the Organization store.
Updating the visuals in the Organization store
For visuals added directly from the AppSource store, the update will happen automatically.
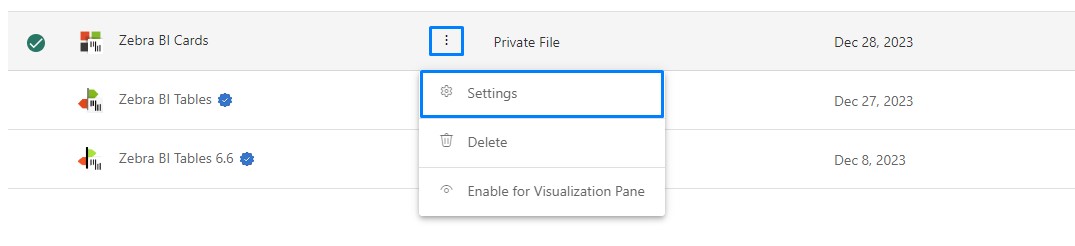
To update the imported Zebra BI visuals to a newer version, simply revisit your Admin portal> Organization visuals, click on Actions, and choose Settings to edit the visuals:
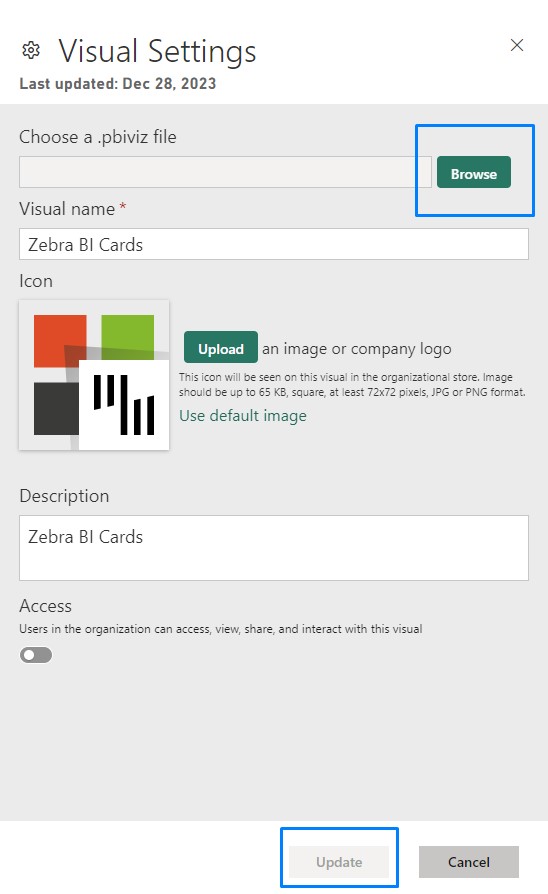
In the pop-up window, click Browse and choose the latest version of Zebra BI visuals. When you’re done, click Update to confirm your choice:
That’s it. Your Organization store now contains the latest version of Zebra BI visuals and the version will be automatically updated in all reports for all users in your company!