 September 8th
 February 22nd
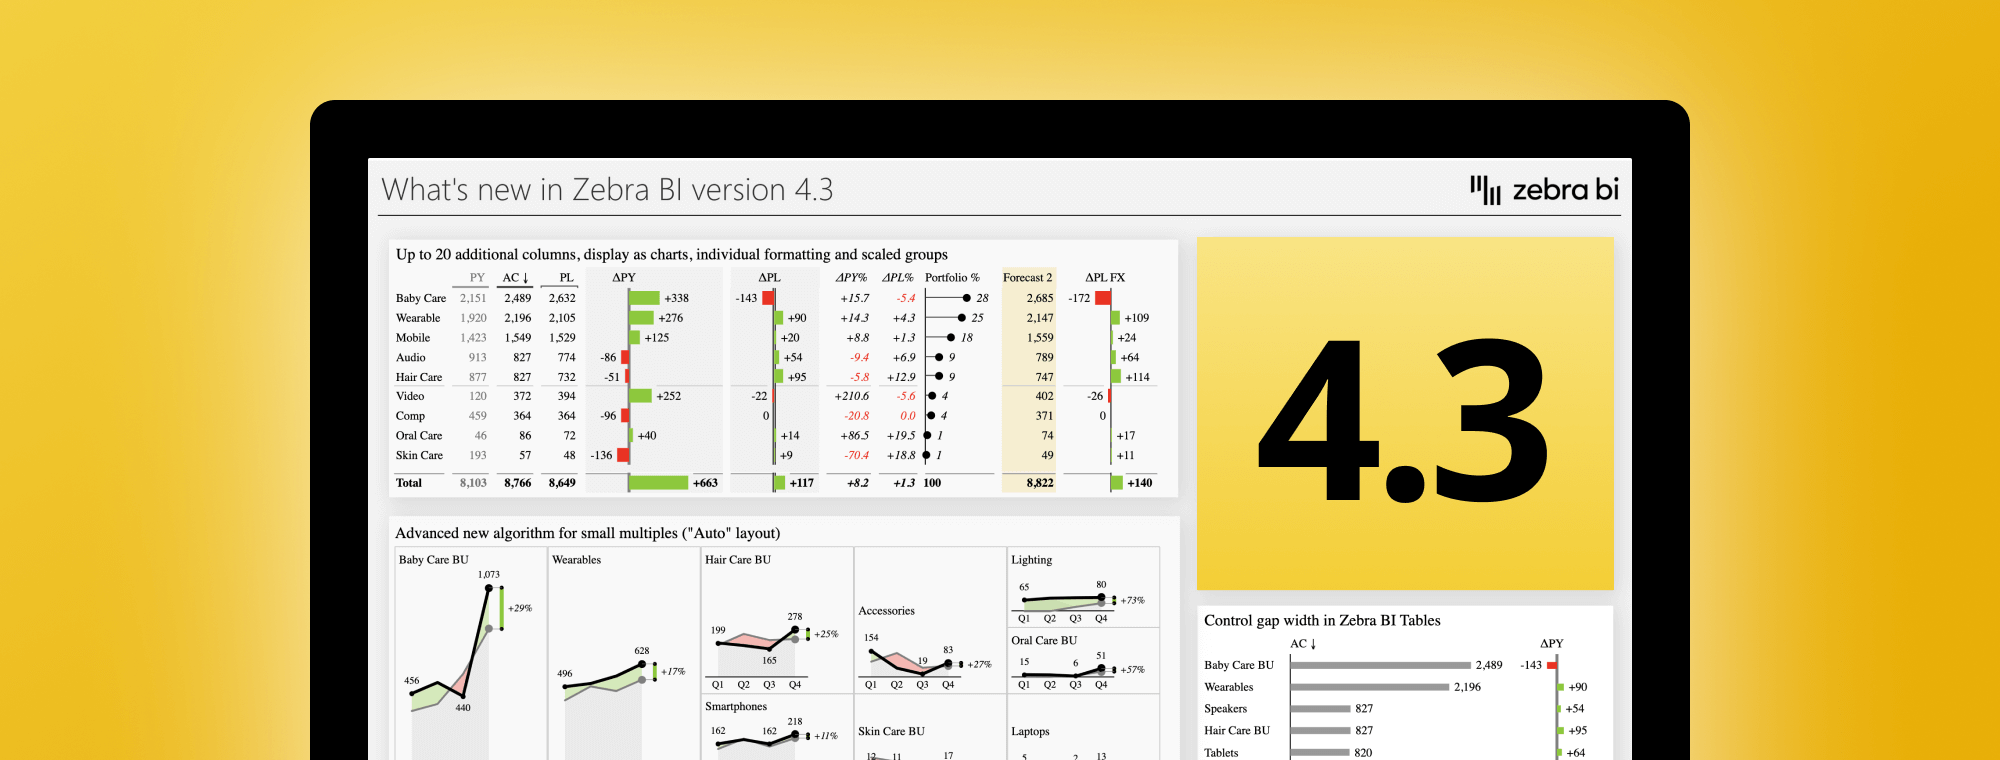
More Advanced Than Ever - Power BI visuals 4.3 version is out!
With 43 new features, improvements and bug fixes the 4.3 Update of Zebra BI visuals for Power BI is one of the most advanced so far. 🚀 We used your feedback to make Zebra BI visuals more advanced than ever before, develop new features and iron out small details.
These are just some of our favorite highlights:
- The revolutionary new algorithm for small multiples — Until now, one big chart could only span over two smaller charts within small multiples. With Auto layout Now it can span over multiple charts, as many as can fit! This will allow you to save space and keep a better overview of your data.
- Up to 20 additional measures — You can now add even more values to your table and compare all of them at once. You can even design each column individually, like determining chart type, customize number format, changing measure type, and much more.
- A brand new concept of scaled groups — You can now group together specific measures and apply a different scale to that group. For example, additional gross-profit measures should have different scaling than default sales KPIs.
- Control gap between columns — We've added the new setting Gap between columns (%), to edit the distance between all columns in a table