Explore
Products
Zebra BI for Power BI
Zebra BI for Excel
Zebra BI for PowerPoint
Live Demo PBI
May 16, 2024
Live Demo Office
April 25, 2024
On-demand Product Tour
Resources
Zebra BI Academy
Resource Hub
Customer Stories
Templates
Webinars
Guides
Help
Help Center
Knowledge Base
Beginner's Guide
101 Crash Course
Chart Selector
Support
Why Zebra BI?
Our customers
Actionable reporting
Supercharge your Power BI
Pricing
Search for:
Login
Try Zebra BI for free
Products
Zebra BI for Power BI
Zebra BI for Excel
Zebra BI for PowerPoint
Live Demo PBI
May 16, 2024
Live Demo Office
April 25, 2024
On-demand Product Tour
Pricing
Resources
Zebra BI Academy
Resource Hub
Customer Stories
Templates
Webinars
Guides
Help
Help Center
Knowledge Base
Beginner's Guide
101 Crash Course
Chart Selector
Support
Why Zebra BI
Our customers
Actionable reporting
Supercharge your Power BI
Log In
Try For Free
Close
Upcoming webinar:
How to make your Power BI reports run up to 10x faster
September 8th
Register
Zebra BI Live Product Demo:
Start creating truly insightful Power BI reports and dashboards
February 22nd
Save the spot
Home
Resources
Warning
: Undefined property: WP_Error::$cat_ID in
/home/zebrabi/public_html/wp-content/plugins/oxygen/component-framework/components/classes/code-block.class.php(133) : eval()'d code
on line
19
Tag:
Reports
Tag:
Reports
Power BI
Guide
May 27, 2021
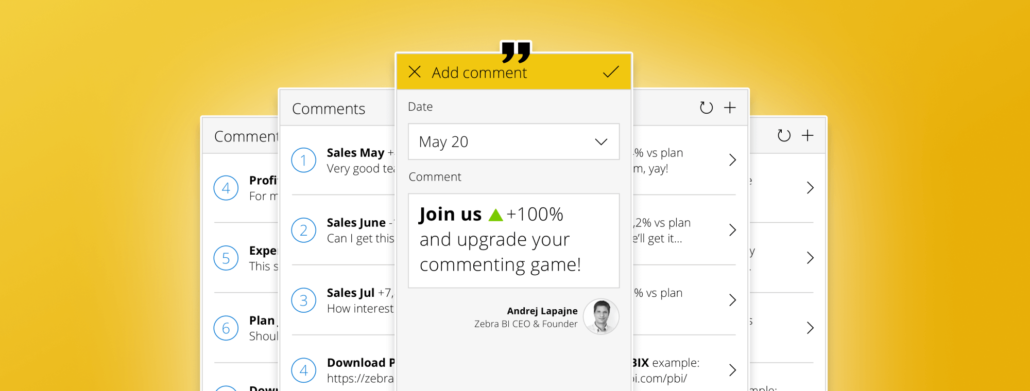
How to Implement Writeback Comments in Power BI Using Power Apps
In this guide you'll learn how to create simple Power Apps that will add dynamic writeback comments to your Power BI reports and dashboards.
Read more
Power BI
Guide
April 11, 2019
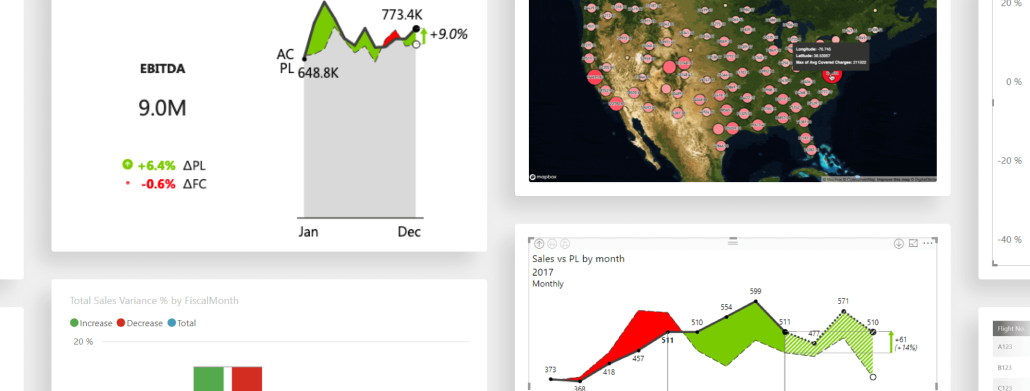
The Best Power BI Visuals (Built-in and Custom) for Actionable Reports and Dashboards
It has never been this easy to visualize and tell stories with your data. We'll focus on some built-in and custom visuals to make your reports more actionable.
Read more
Excel
Guide
March 3, 2016
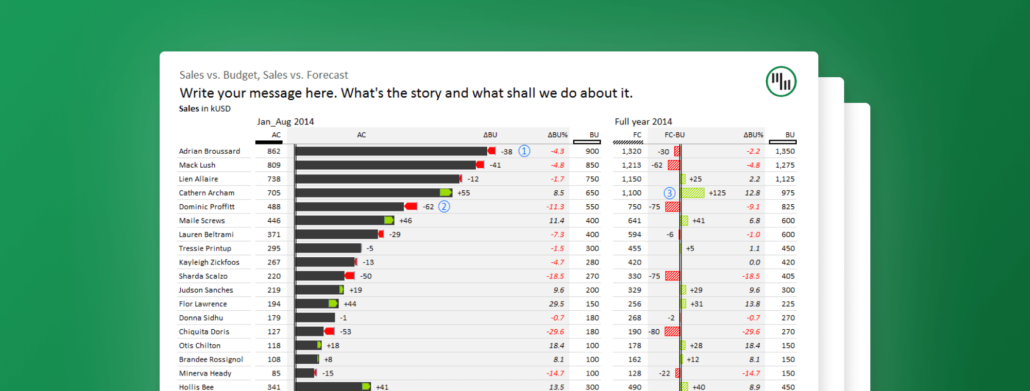
Struggling to visualize your data? Zebra BI's got you covered!
Whether it’s waterfall charts, variance charts, or lollipop charts, Zebra BI has everything you need to visualize your data for all to understand.
Read more
Pagination
1
2
»
Product
Zebra BI for Power BI
Zebra BI for Excel
Zebra BI for PowerPoint
Latest Releases
Changelog
Zebra BI for Power BI Pricing
Zebra BI for Office Pricing
Resources
Webinars
Templates
Guides
Zebra BI Academy
Blog
Community Events
Legal documentation
Help
On-demand product tour
Live product demo
Knowledge base
Beginner’s Guide
Zebra BI 101 Crash Course
Chart Selector
Company
About
Careers
Customers
Become an Affiliate
Find a Partner
Terms of Website Use
Contact Sales
Technical Support
© 2021 – 2024 Copyright Zebra BI d.d. All rights reserved. Various trademarks held by their respective owners.
Privacy Policy
Legal documentation
Try it in your Excel. For free.
angle-up
angle-down
youtube-play
question-circle-o
dropdown-down
TimelineArrow
arrow
download
facebook
ln
logo-black
menu
no
search
twitter
 September 8th
 February 22nd