Marketing budget variance analysis in Excel
Zebra BI for Excel
Overview
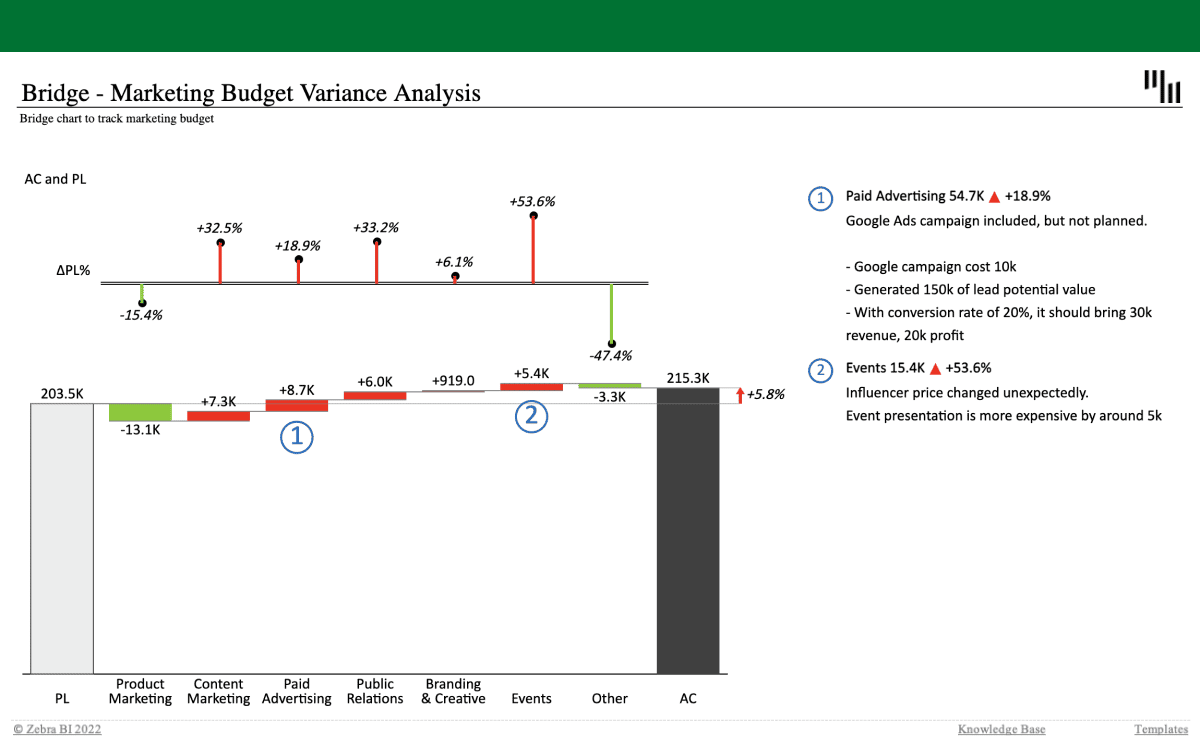
Use this template to find out how different marketing areas perform compared to the plan (or budget). The bridge chart enables you to quickly identify the problems and dynamic comments help provide more insight into your performance.
Inside this template
Subtotal difference highlight
Dynamic comments
Automatically calculated variances
Custom calculations
Get started in 3 steps
1
Download & Open
Download the .xls file and open it in Excel
2
Connect Your Data
Replace sample data with your CRM, ERP, or database source
3
Customize & Publish
Adjust KPIs, colors, and branding, then publish to Power BI Service
Fill out the form and get the Excel template
20,000+ users have downloaded this template


