
The Future of Data Storytelling: Actionable Intelligence [AI, Power BI, and Office]
PRO Trial
It's that time of the year. We're all busy planning for 2024, and Zebra BI is no exception. Let's look at how Zebra BI solutions meet your needs today, our upcoming new features, and where our innovations are heading with AI.
First, let's briefly examine the core business process inspiring our efforts: the cycle of reporting, planning, and presenting.
The three stages of this cycle include preparing dashboards and reports during the reporting stage and then submitting your insights to what-if scenarios during the planning stage. Once you have your final insights, it's time to present them and take action, which is where you generate real value.
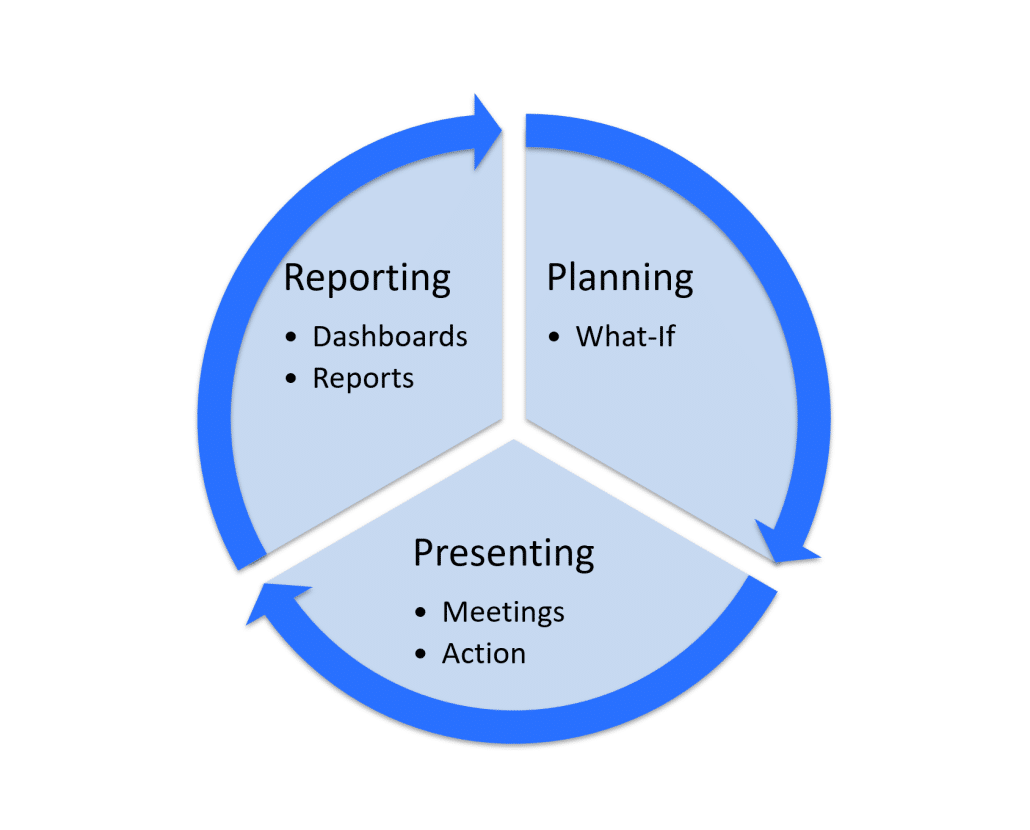
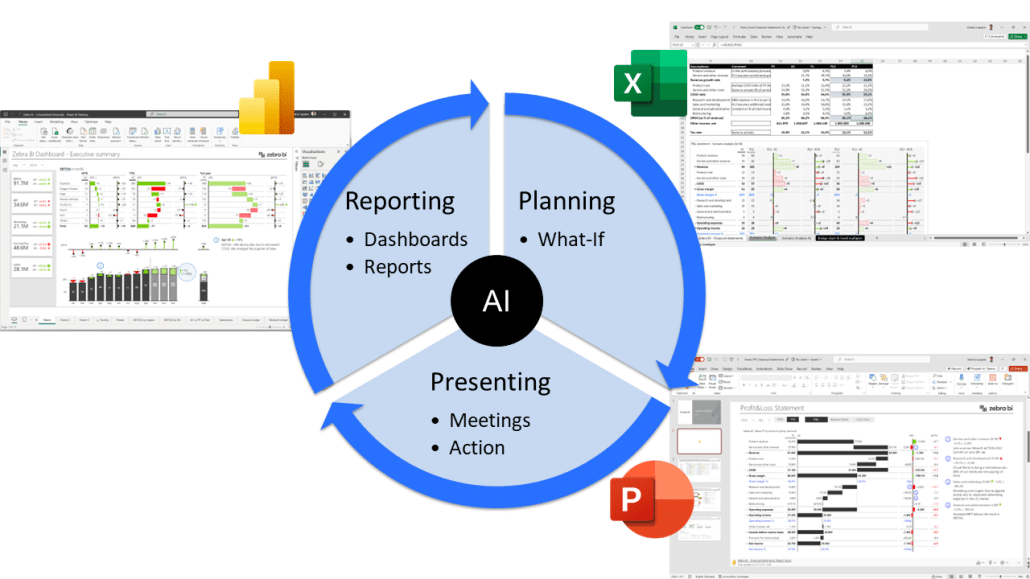
Each of these stages is often carried out using specific tools. For example, much of the reporting and dashboard creation is done in Power BI, while planning is still heavily dependent on Excel. And when it comes to presenting your insights, of course, PowerPoint continues to rule the roost.
Our first goal in this blog post is to show you how to move swiftly along this cycle and seamlessly switch between different tools while maintaining a consistent system and notation to tell your story. The end aim is to have a single version of the truth that is consistent, understandable, and actionable so it can drive informed decisions based on accurate data.
There is one more piece to this puzzle, and it's on everybody's minds today. We're talking about artificial intelligence that will change, transform, and disrupt all of these stages and all of these tools. This is why we'll look at how AI plays into our plans at Zebra BI and how we will integrate it into our stack.
A few initial words on reporting
Last year, Zebra BI released our actionable reporting manifesto, which preaches the value of clean and understandable dashboards and reports. It calls upon analysts and business users to eliminate the colorful and messy reports, presentations, and dashboards that people typically use in their companies. These essentially prevent business users from actually understanding the insights from the data, lock away the value of those insights, and prevent the actions from being taken.
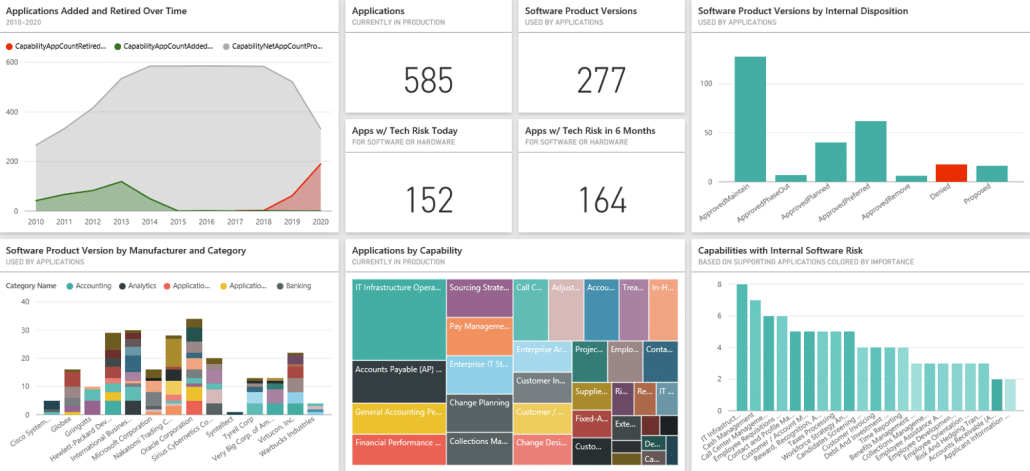
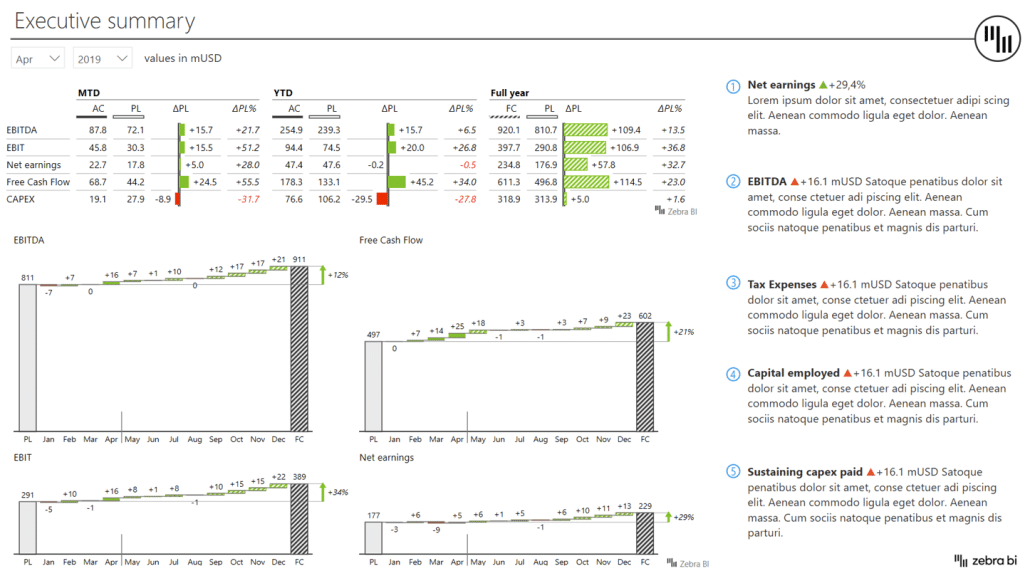
In a nutshell, we are preaching against reports like this:
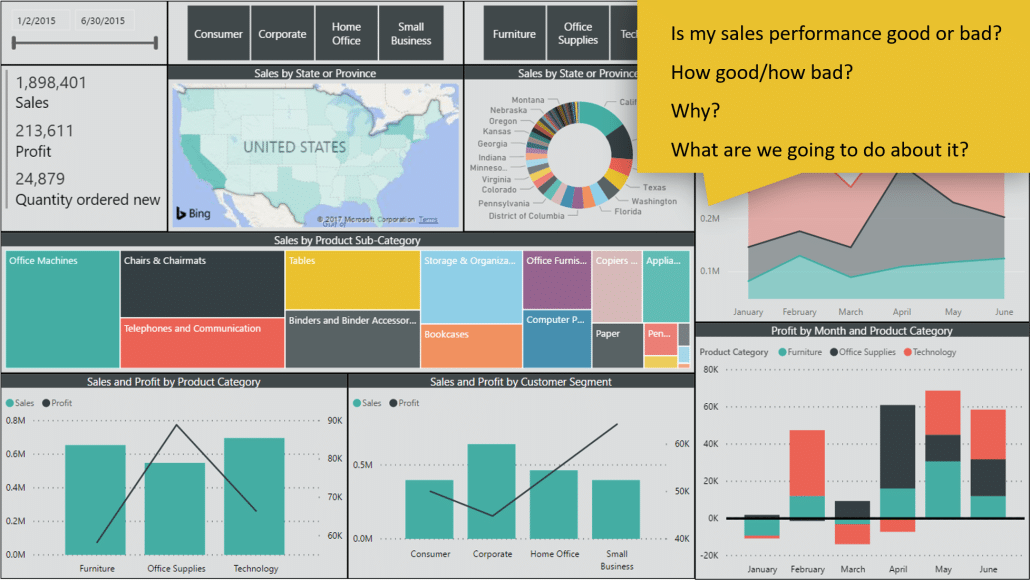
Looking at this dashboard, you don't get any answers even to the simplest questions, such as "Is my sales performance good or bad?" You cannot even see how you performed against your plan or understand why your performance is suffering.
That's not actionable data.
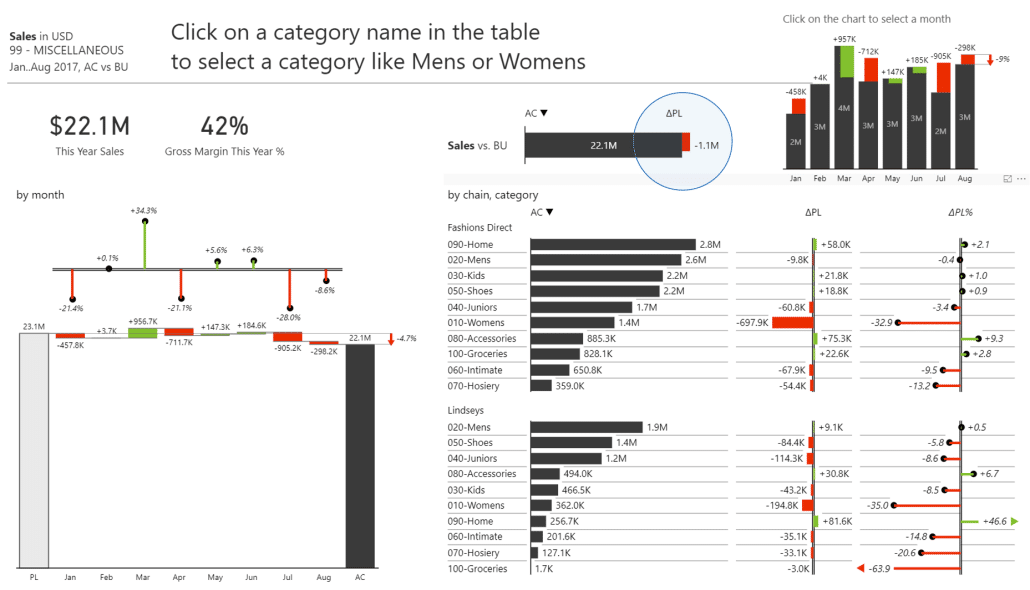
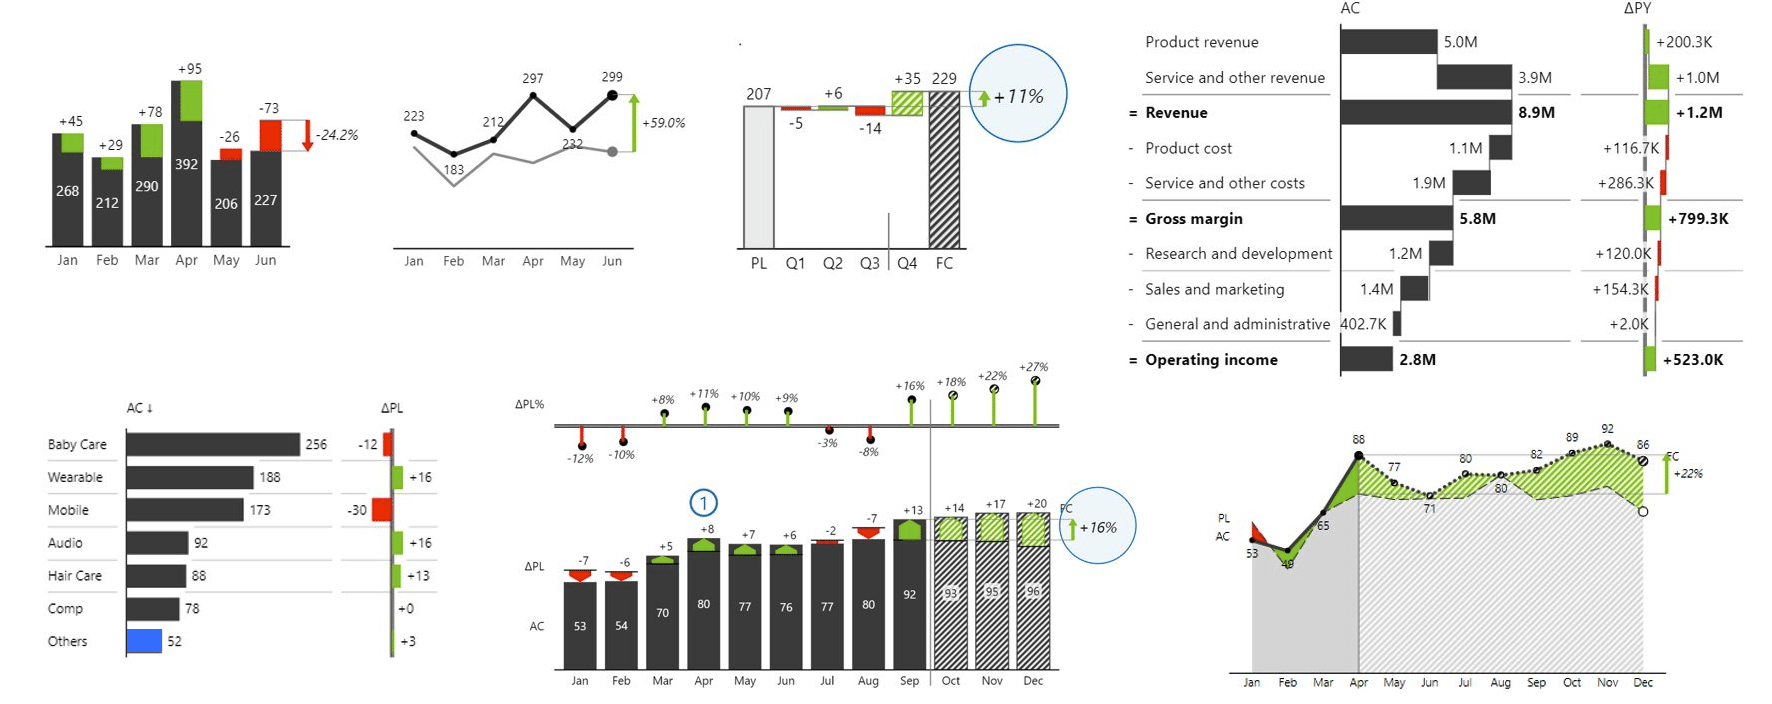
We are vocal about clarity and maintaining consistency across all the tools you have in your company, which means you should be using the same shapes, colors, clean charts, legible labels, and other elements. This results in what we define as good reports and dashboards:
In our manifesto, we have come up with 7 essential rules for clarity:
Rule #1 - Right choice of charts
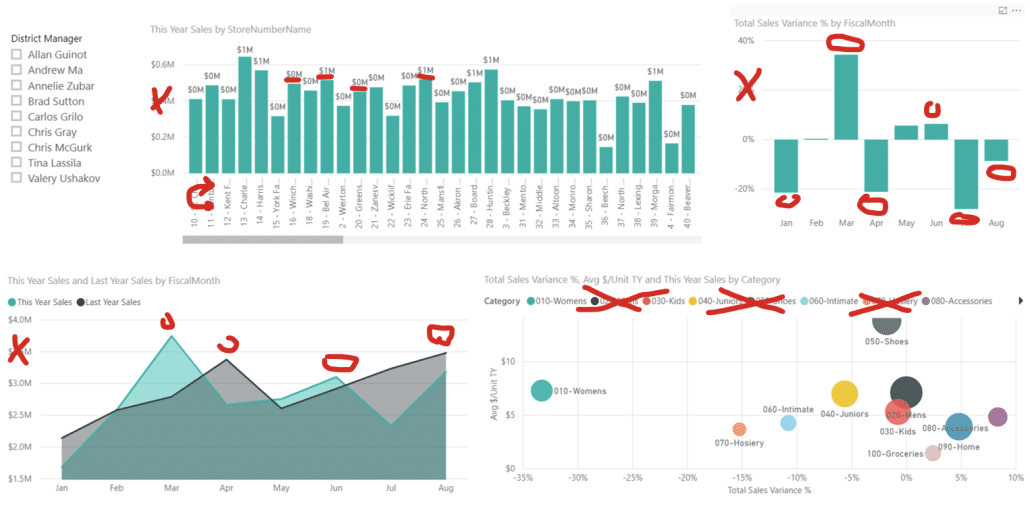
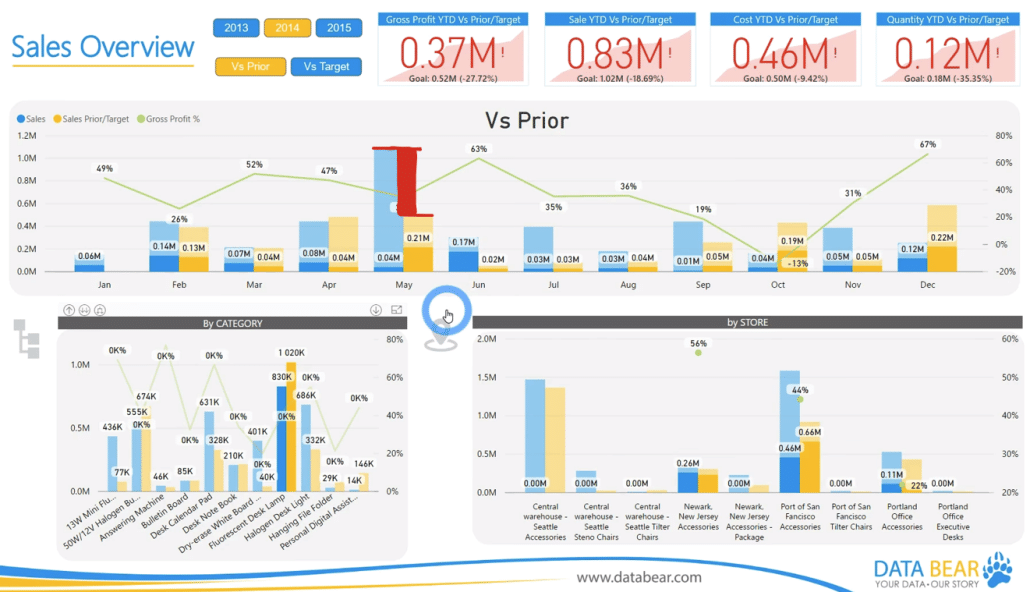
This is a simple rule to follow: avoid high charts, tree maps, and colorful charts that don't communicate the real situation, the changes, or the variances. We're talking about charts like these:
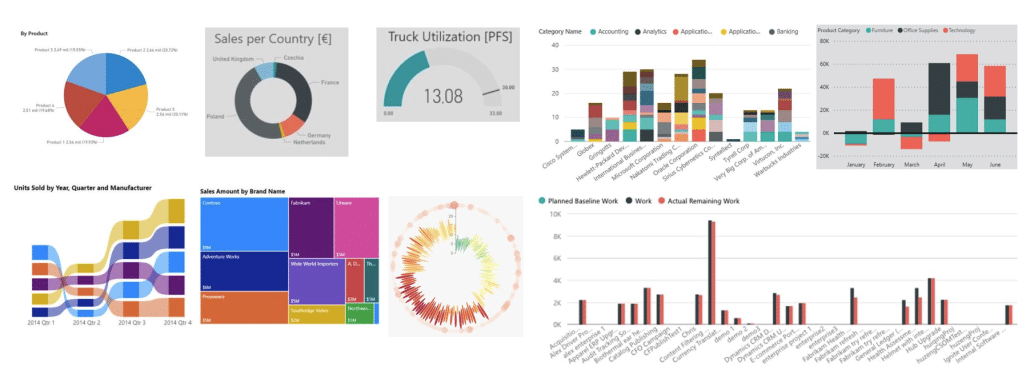
Replace those charts with clear, actionable, and understandable visuals with consistent presentation and notation.
To take the guesswork out of designing your visuals, Zebra BI supports the IBCS standard for business communication, making it much easier to design consistent and clear visuals.
You can learn more about our efforts to maintain IBCS in our products in our blog post about Zebra BI and IBCS.
Rule #2 - Using proper labels
Next up are proper labels. Use legible labels with proper orientation and clear positioning. Here are some examples of poorly designed labels. Most are either in the wrong place, formatted incorrectly, or have a wrong orientation.
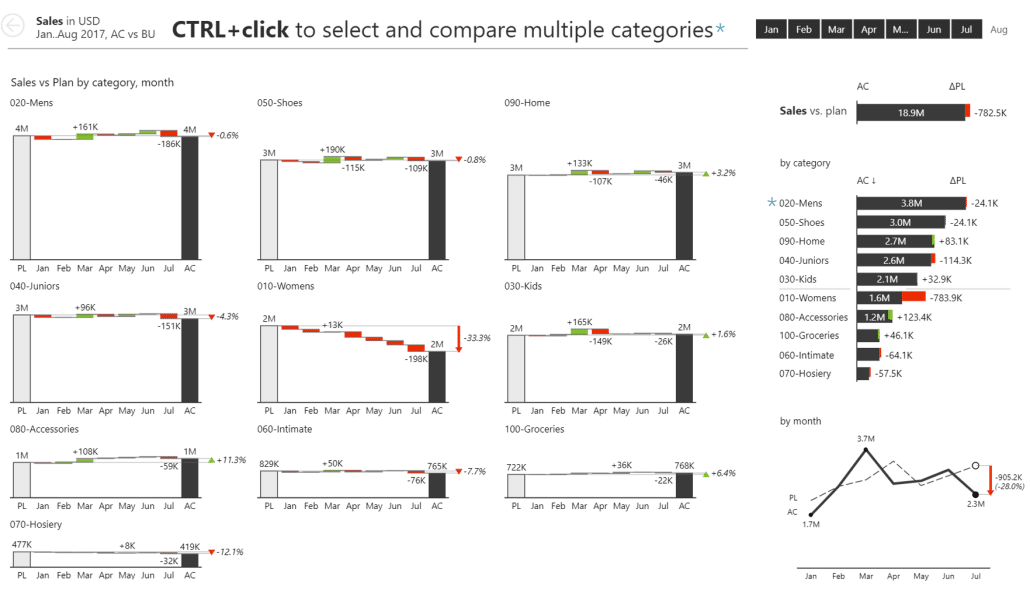
If you use labels correctly and have clean, precise, and horizontal labels that everyone can see, you can increase the information density of your charts without sacrificing clarity. Here is an example of a single dashboard with 13 charts that is still perfectly readable and clean.
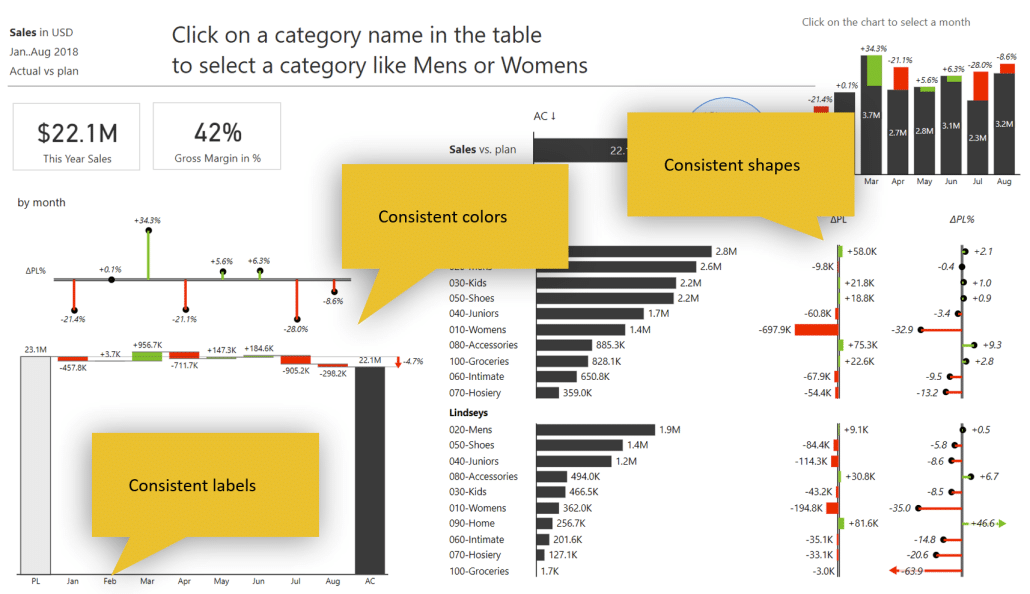
Rule #3 - Consistent colors, labels, shapes
Lack of consistency is another strike against actionable reports. Presentation and data analysis tools sometimes provide too many options, so people rely on inconsistent design elements when creating their dashboards and reports.
Ideally, you want to use the same color or shape to convey the same meaning. For example, at Zebra BI, we introduced the IBCS standard that solves this problem beautifully. You have consistent colors and consistent shapes that always mean the same. For example, the same chart shape is always used to show percentages and forecasts, previous year result columns are always shaded the same way, etc.
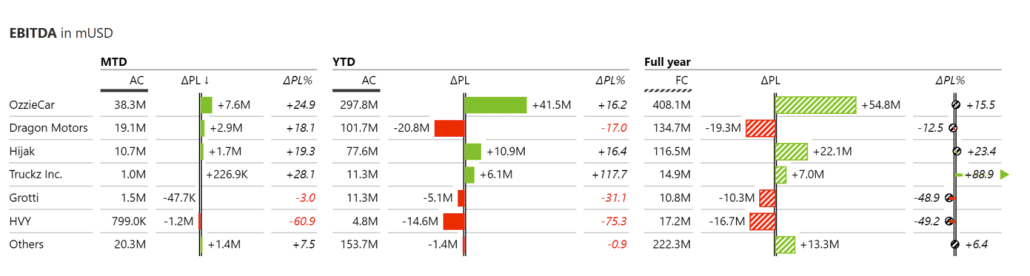
Rule #4 - Display variances
You should always display variances because valuable information is found where the change is. Unexpected things are interesting, which is why you should always display the variances in your comparisons.
In fact, variances are a great tool to guide your listeners' and readers' attention. You can focus their attention with the use of color so they can easily hone in on what's important. For example, this dashboard very clearly communicates problem areas that draw attention.
Rule #5 - Add comments
Add qualitative information to your quantitative tables, charts, and data presented in tables and charts. Fuse the two worlds together. Ensure that comments add context and understanding for the users looking at your dashboards.
Rule #6 - Show forecasts
Your reports shouldn't just look at the past but also into the future, which is why you should use forecasts in your charts, reports, tables, analyses, and presentations. Here is an example of a visual using forecasts (shown with the hatched pattern).
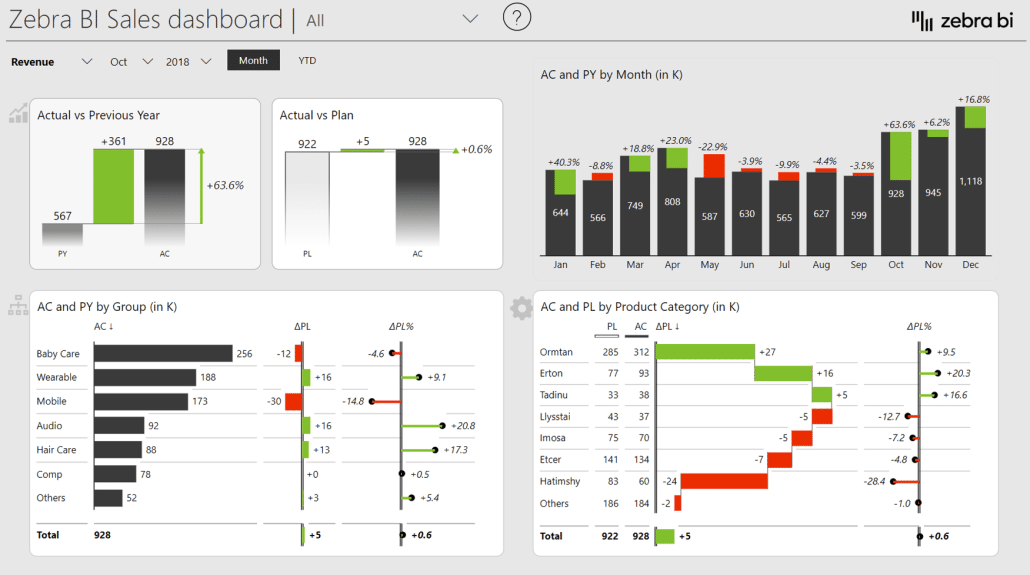
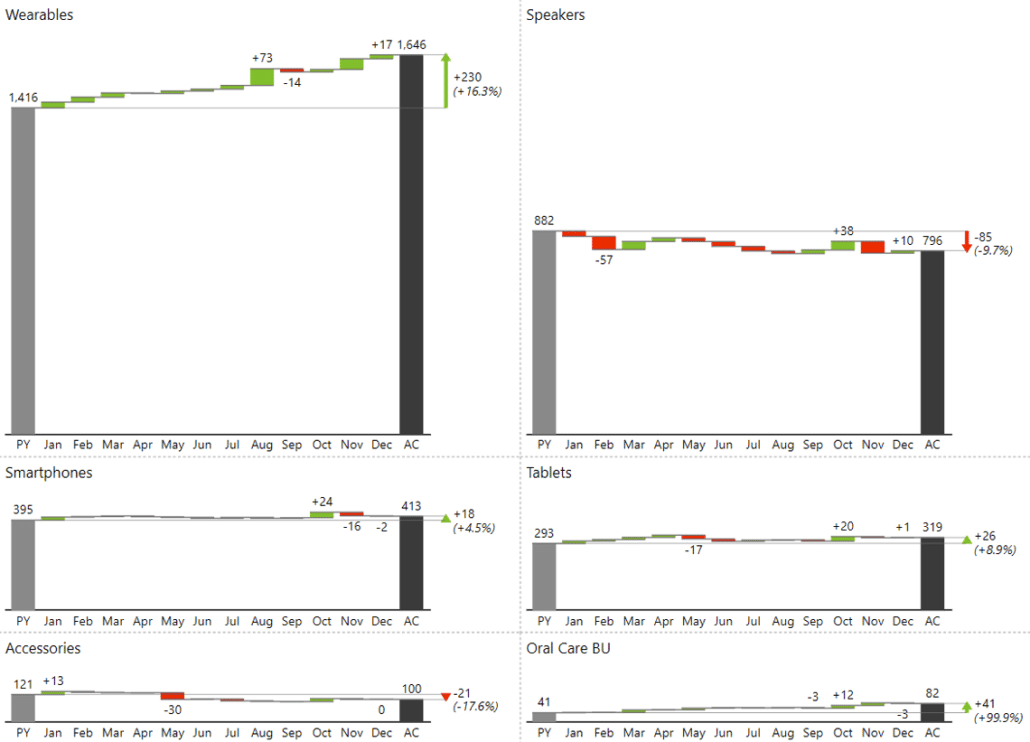
Rule #7 - Correct scaling
Make sure that if multiple charts are presented, they are rendered to the same scale so that people understand the relations between data categories. In this example, the chart for wearables is significantly larger than others. The wearables data category is 1.6 million, and the next one is just 0.8 million, which is basically half of that, and the size should reflect that.
The world of reporting is changing
These are the issues we were talking about a year ago. So, where are we now, and what is new? First of all, with the increasing level of automation in the tools we use, the focus is slowly shifting to data storytelling. Since users can now create meaningful reports in seconds, there's no more fiddling with individual reports.
We can say that in the future, most of the creation and generation of charts and dashboards will be automated. This means that the users can focus on adding commentary and explaining data instead of formatting data and charts. AI has accelerated this long-term trend, and this shift will keep happening in the coming weeks, months, and years.
This is something that is also shaping our development in Zebra BI. Let's look at what we are doing.
Dynamic features for flexibility
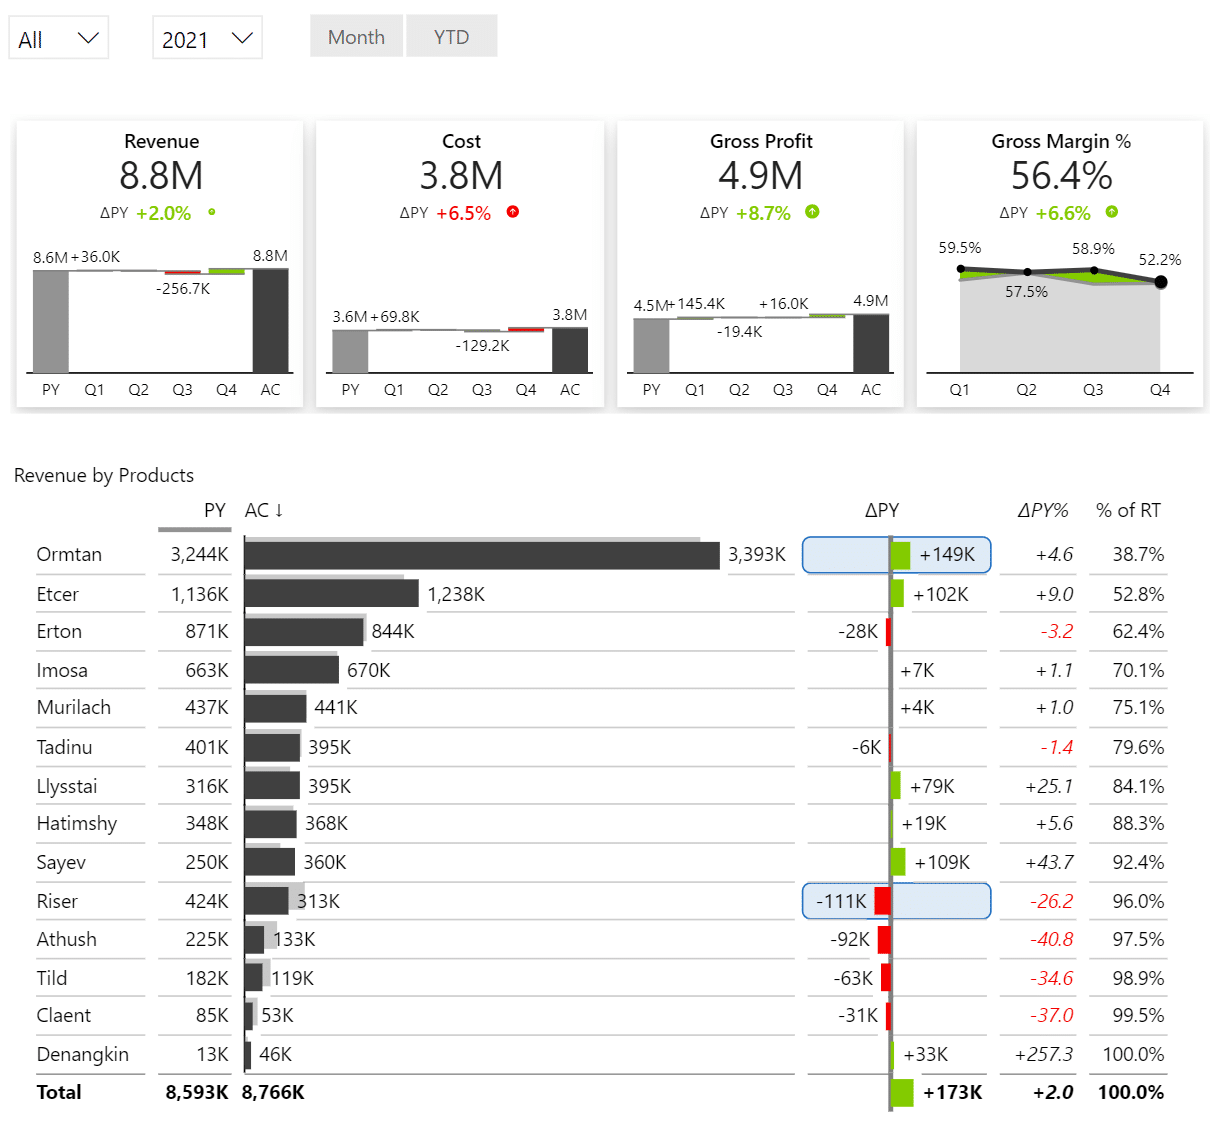
For a quick overview of some of the features we offer right now, we'll start by creating a combined visual consisting of cards displaying individual KPIs, such as revenue, gross profit, costs, and gross margin.
Below is a product breakdown that changes based on the KPI selected on the Zebra BI Cards visual.
What we want to do is to change titles automatically based on the KPI that we selected. This can be done by using the Dynamic Title feature. You simply click on the visual title and enter the title as [Selected KPI] by Product.
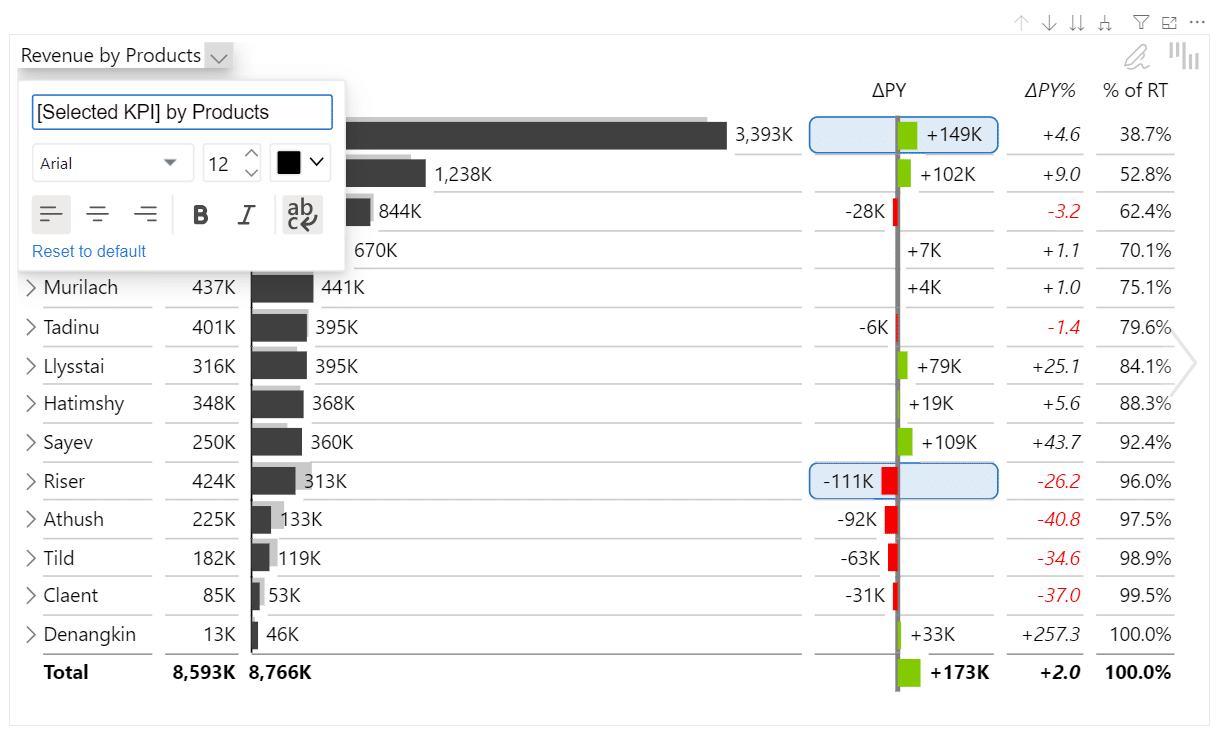
When you switch between KPIs on your Cards visual, the title will also change to reflect your choices.
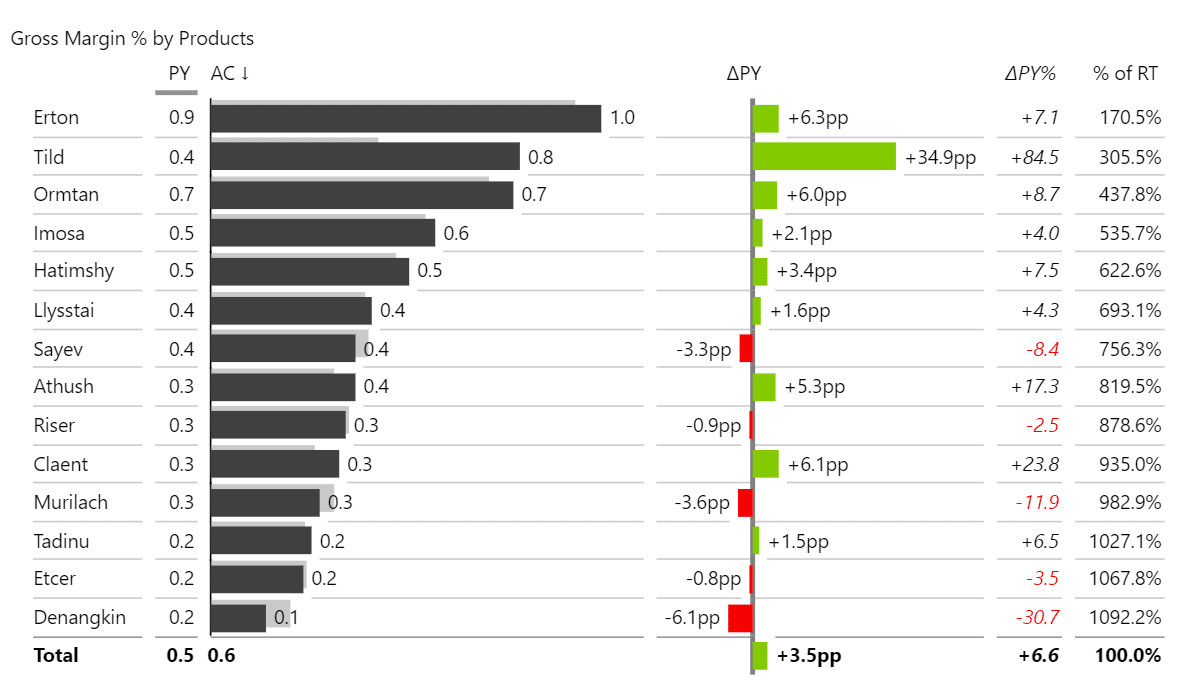
Another new feature is the ability for visuals to read the format of numbers directly from the Power BI data model. If, for example, the revenue was formatted in millions and thousands while the gross margin is displayed as a decimal number, it would look like this:
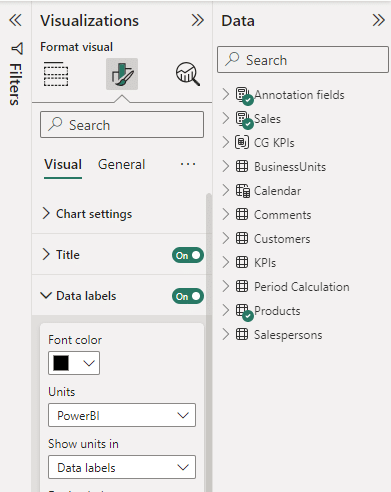
But ideally, we want to have them displayed as percentages. You can do this by opening the visual settings and expanding the Data labels section. Here, select Power BI from the Units drop-down menu.
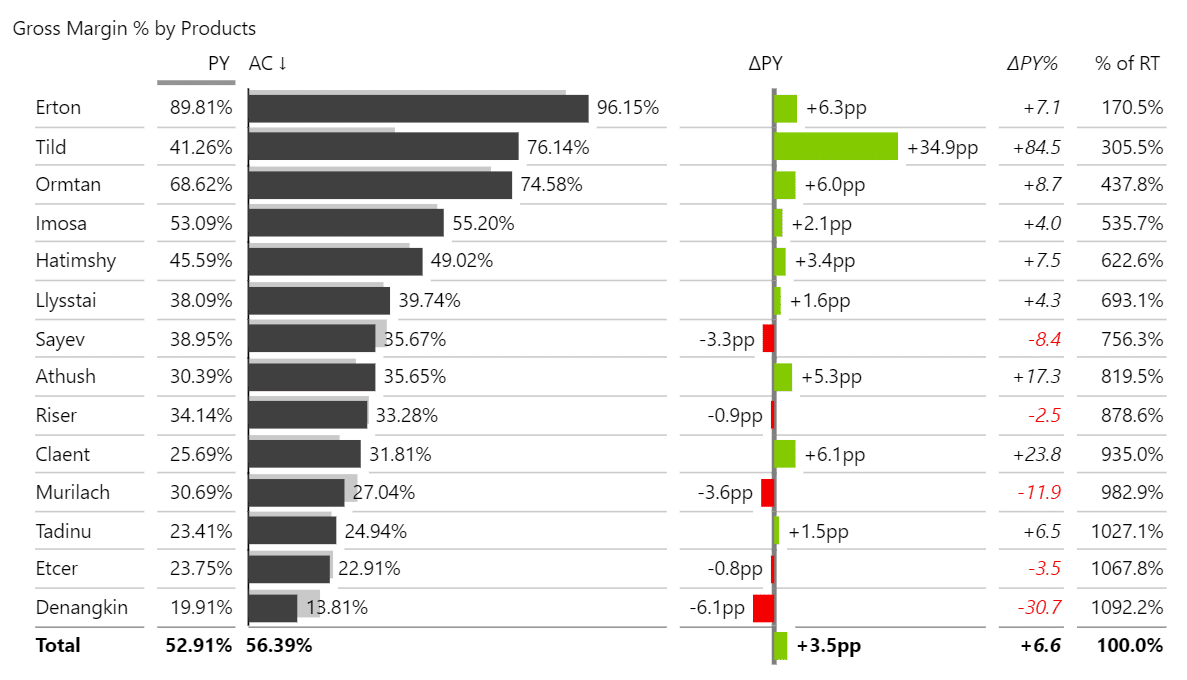
When you do this, the data is displayed correctly:
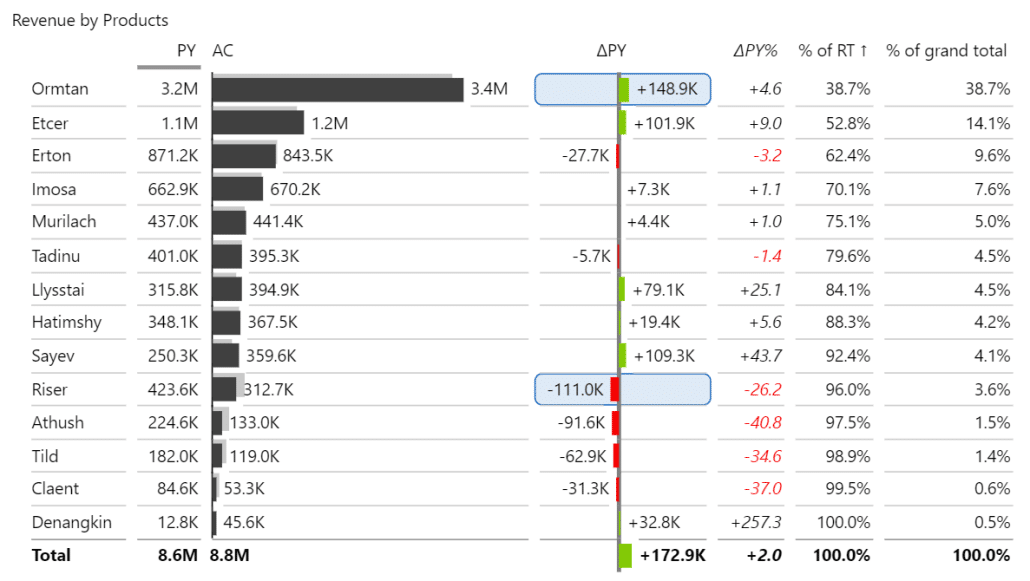
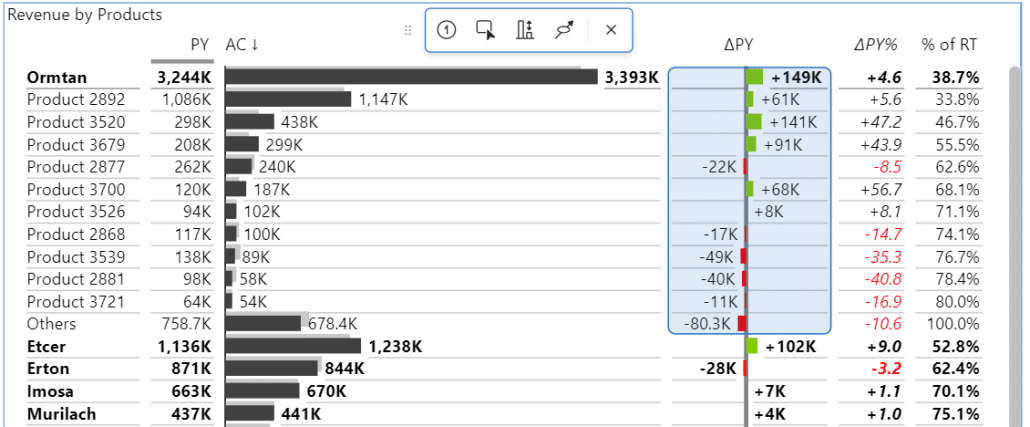
The next interesting feature is the ability to display Top N items, which means the visual will display only the most important products. This comes in handy when we have many items on a table, like here, where individual product groups can be expanded into individual products:
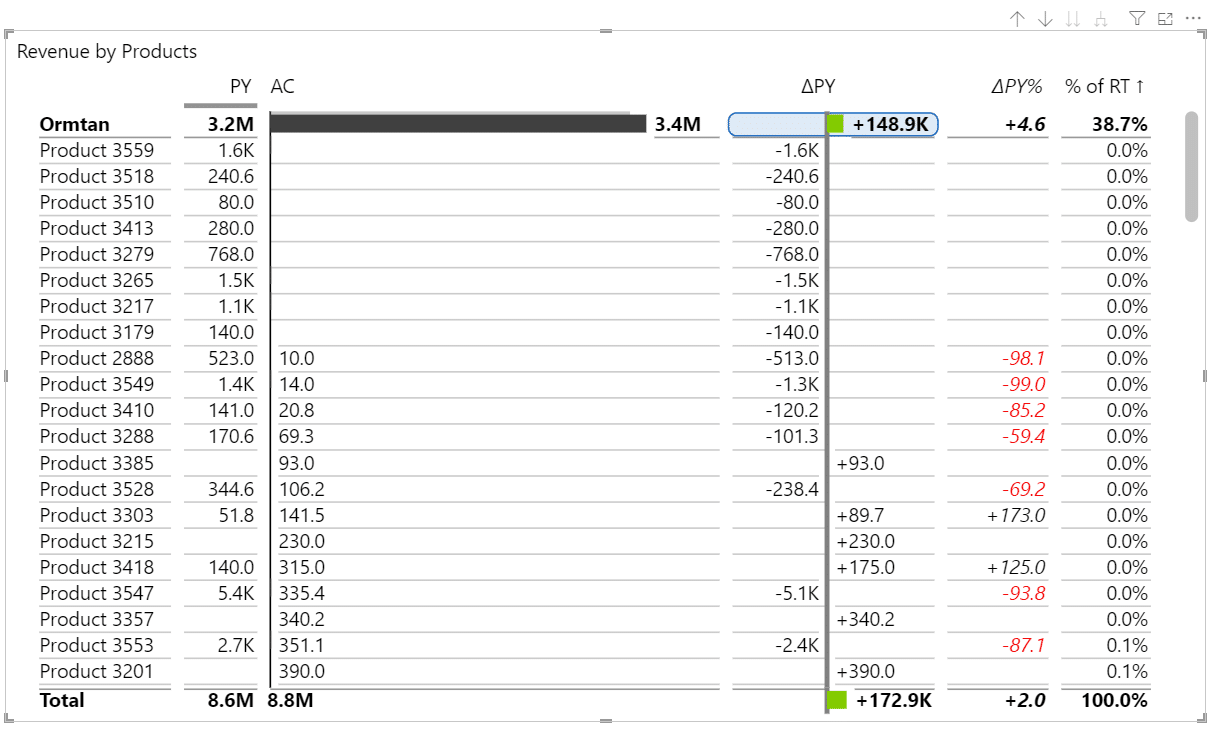
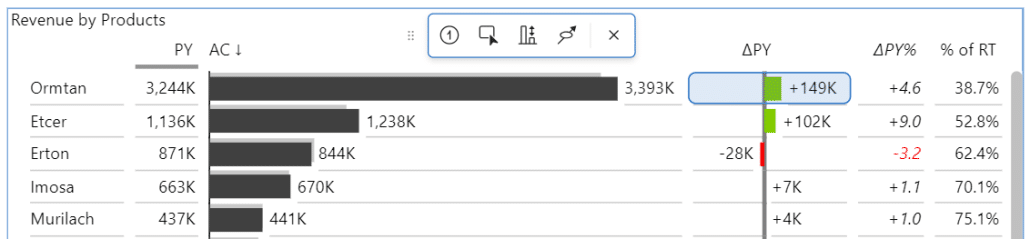
However, this information will be overwhelming to most readers. The best thing to do is to limit the number of displayed products to the ones that best describe our performance (in the following example, the top 7).
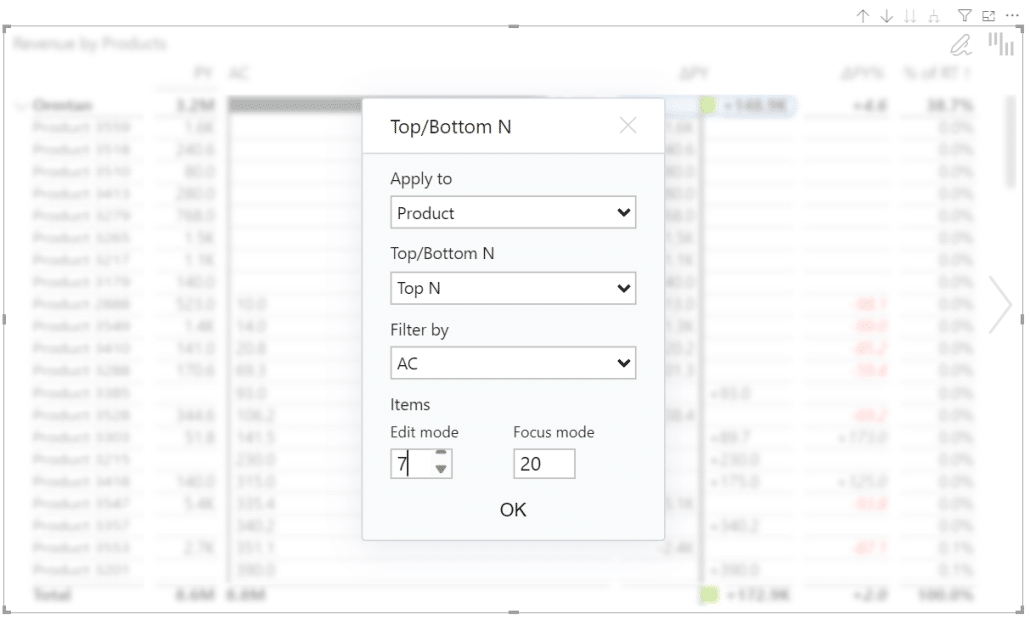
Right-click on the categories column and select the Top/Bottom N functionality. Apply it to the Product category and select the Top N option. Then, choose the number of products you want to show.
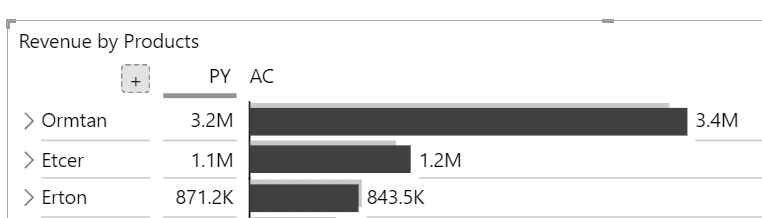
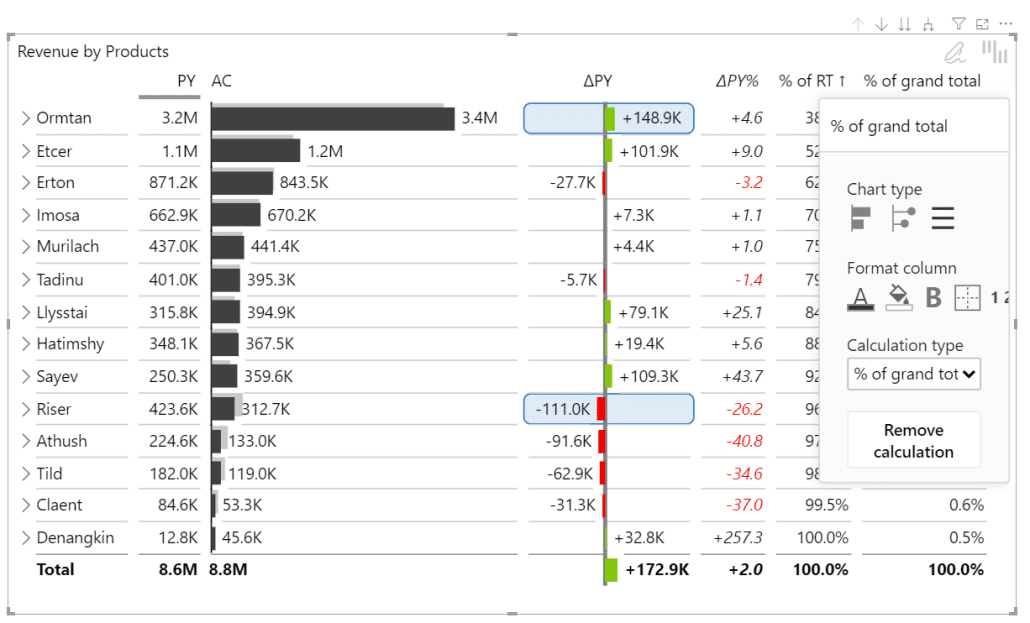
Another feature that gives you more options when working with your Zebra BI visuals is Quick calculation. It adds some preconfigured calculations to your visual.
Click on the + symbol in the top row of your visual.
Select Quick Calculations and "% of grand total."
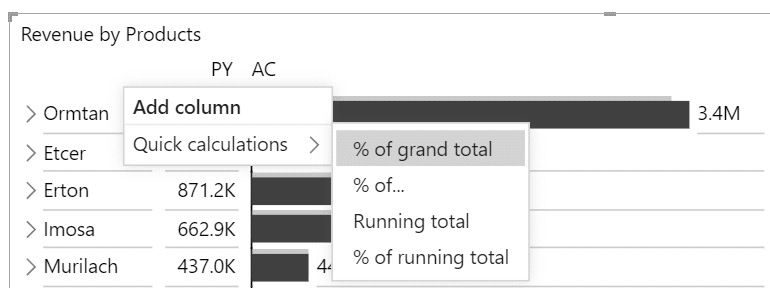
This will add another column that is automatically calculated directly on the visual.
It offers all the formatting options and settings of other visuals so that you can change it to a different visual or change it from percent of grand total to percent of the running total. All of this is done directly on the visual without adding manual calculations.
A new era of storytelling
As we have seen, it is becoming increasingly important for report designers to move beyond merely displaying the numbers and letting viewers come to their own conclusions. You must improve storytelling by focusing your viewers on the important messages and conveying the insights.
And to do this, you need powerful tools, such as Zebra BI.
New ways to add comments
We're working on a new feature called Annotation Layer. This is essentially a set of features that allows you to add comments and highlights to your visuals on the fly without having to fiddle around with the data model.
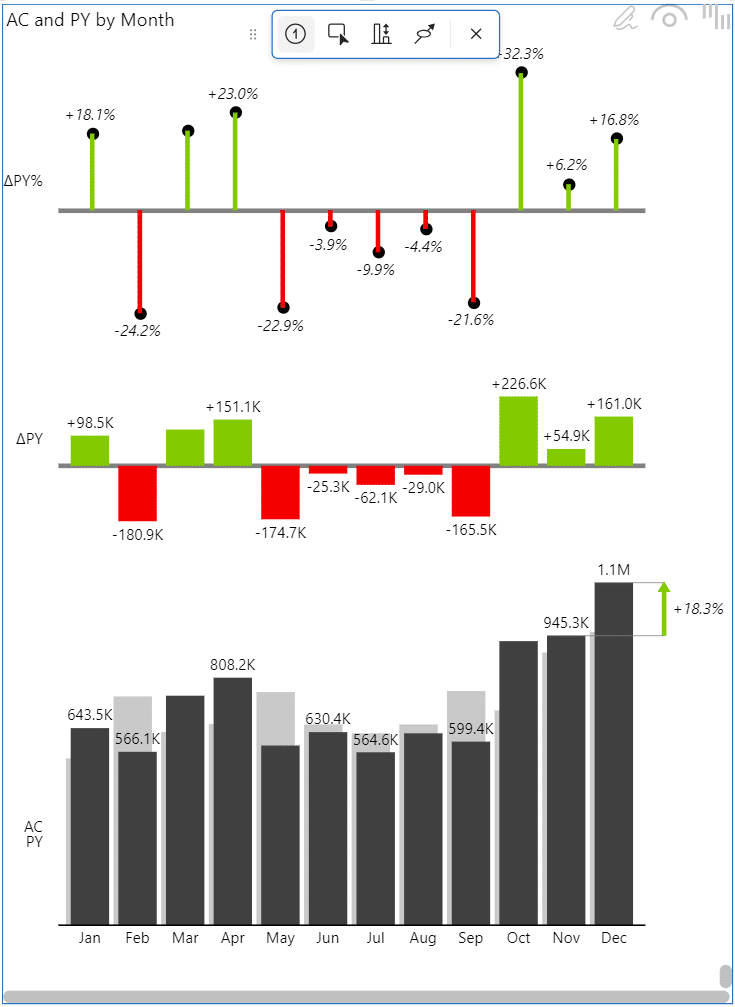
How does it work? The first button is the comment marker that you can use to add a new comment directly to the chart. In our example, we've added a comment to the Revenue KPI in October. This means the comment will disappear when you switch to a different KPI, such as the gross profit.
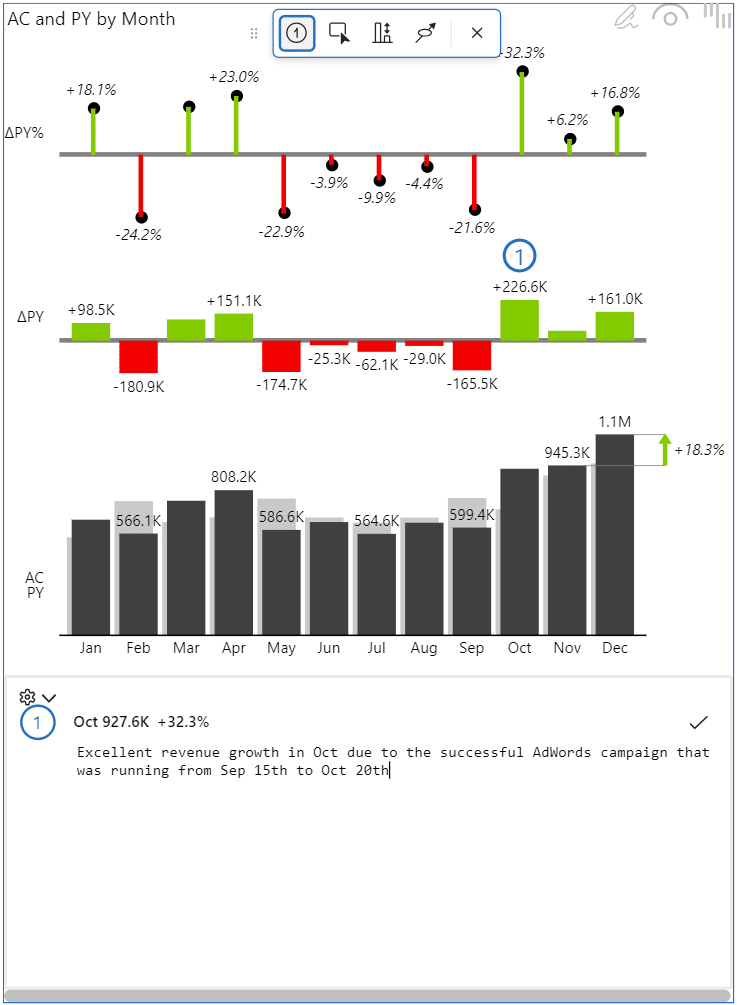
You can do this anytime. Let's say you're presenting to your board and want to add a few last-minute clarifications. You can do this in just a couple of seconds, which expands your options regarding storytelling.
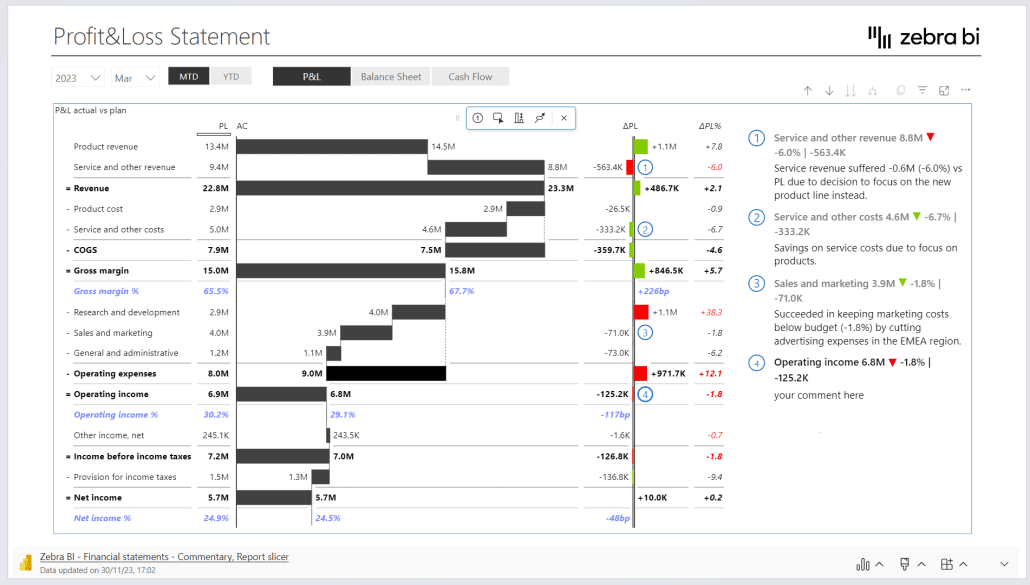
We've made other improvements when it comes to comments. For example, when you are working with a hierarchical report such as this Profit and Loss Statement, comments are hidden until you expand the hierarchy and show the data points that include the comment. However, we wanted to include a way to let the reader know there are comments in the report, so collapsed items are marked with a comment indicator.
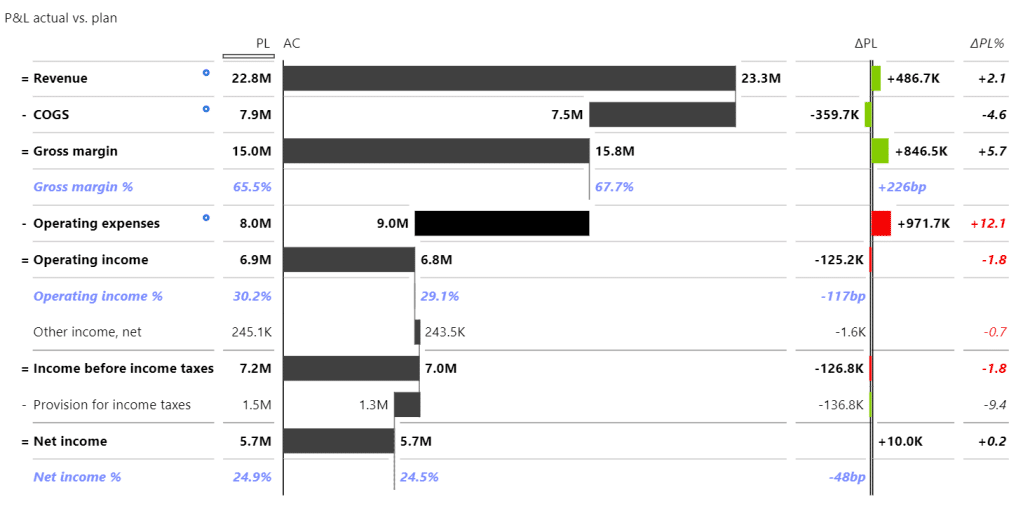
Comments will not be revealed until you expand the levels to which they belong:
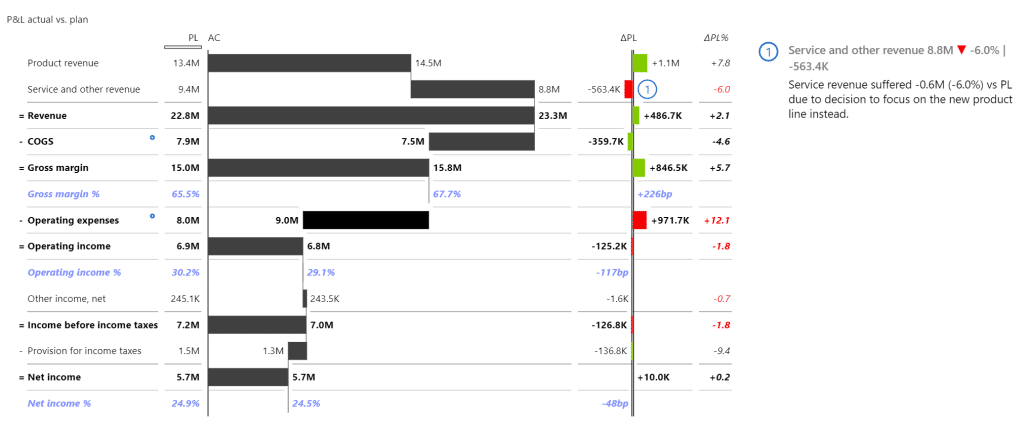
Zebra BI allows you to mix and match comments from your data model and comments added through the annotation layer. Here is an example where we used the annotation layer to add several comments to the comments that existed beforehand in the comments table.
The great thing about this is that comments will be filtered out if you change to another KPI (balance sheet or cash flow) or the month.
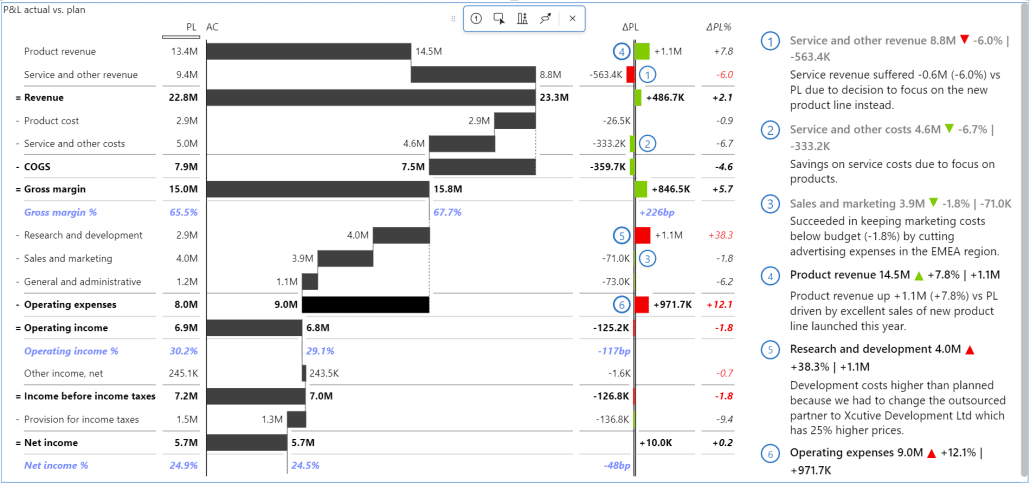
Area highlights
The second button on the annotation layer bar is Area Highlights. You can use this tool to highlight a group of data points quickly and showcase how a certain product category performed.
This is a really flexible feature. As you can see, this product category uses the Top N view option. The highlighted area will automatically adjust if you reduce or increase the number of data points visible and will shrink if you decide to collapse the product category.
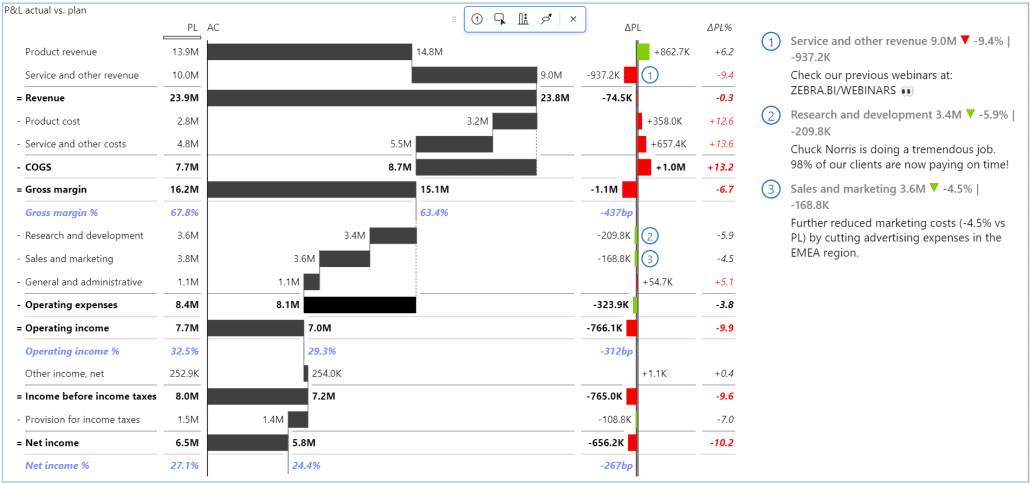
Area highlights work similarly to comments in that they only apply to a specific view. For example, if you switch to another month or KPI, the highlights will disappear and only become visible once you switch back to the initial view.
Highlights are a truly flexible feature. You can draw them across different columns or rows, allowing you to direct your readers' attention however you like.
Keep a single version of the truth
As we mentioned at the start, the reporting, planning, and presenting cycle involves multiple tools, including Power BI, Excel, and PowerPoint. The great thing about this is that once you have your data sets in Power BI, you should reuse them in other tools, and Microsoft makes it easy for you to do that.
You can connect your Excel tables and PivotTables directly to your Power BI data sets. This will allow you to keep all your security settings and ensure everything works.
Let's create a live connection from Excel to a Power BI dataset.
Click on PivotTable and select the "From Power BI" option.
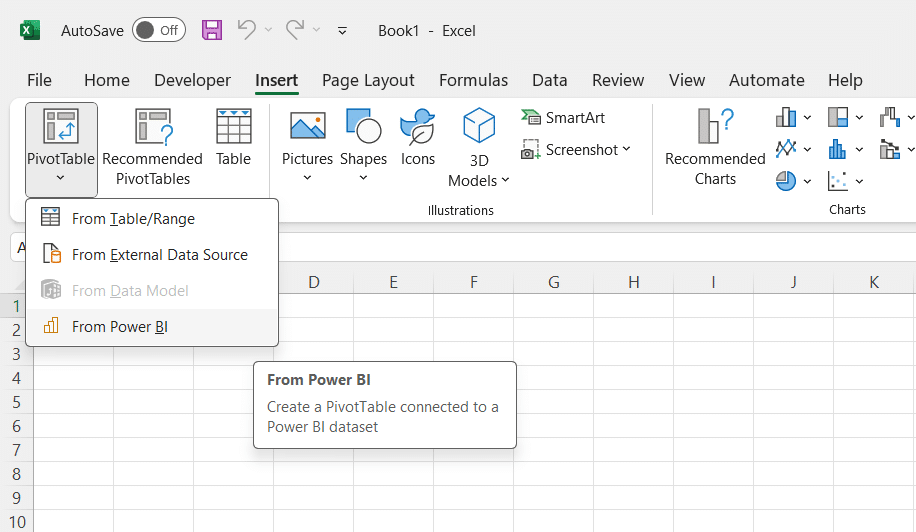
A side pane opens, where you can look and connect to the required dataset.
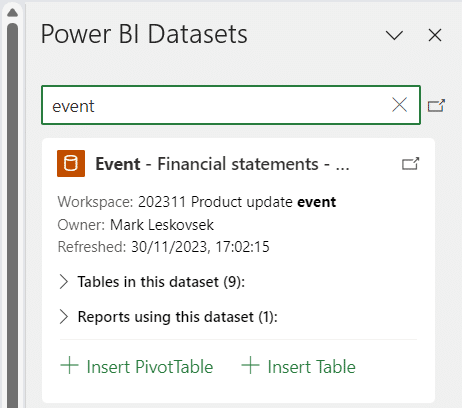
This will add a Pivot Table to your Excel spreadsheet. You have all the fields from Power BI available here, so you can add fields, data measures, and filters.
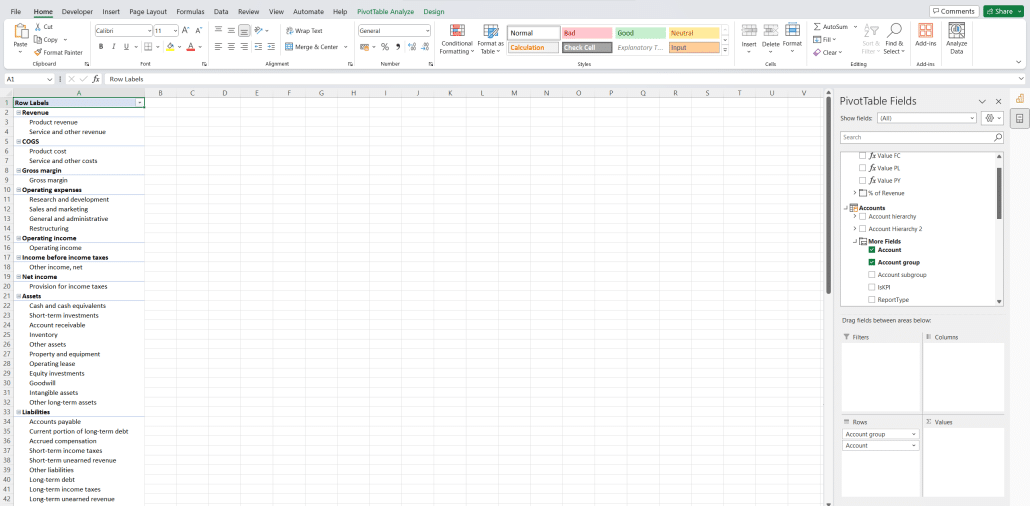
The great thing about this approach is that you are working on a single version of truth. The way to get to this is to connect directly. Don't copy data, and don't export data and import it between tools.
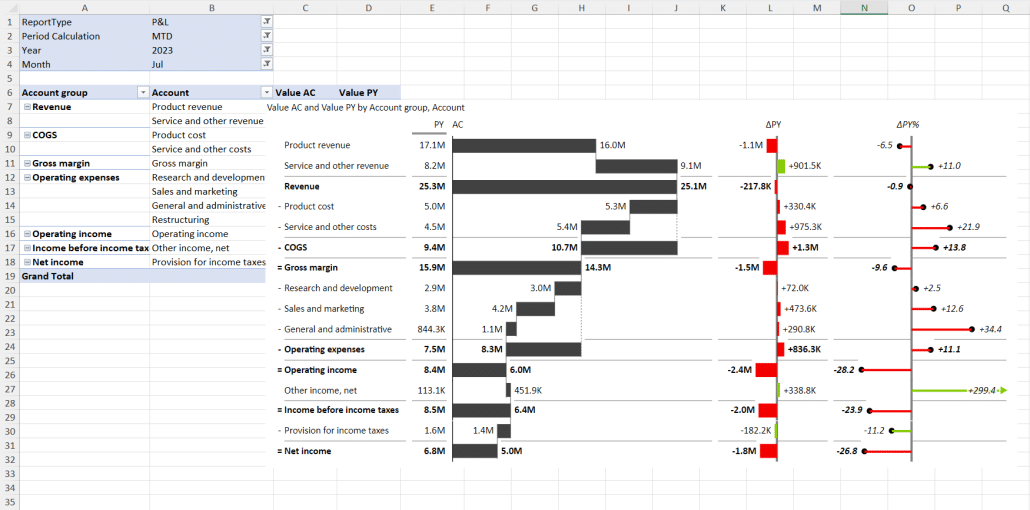
Once you have your data in Excel, you can use Zebra BI for Office to create what is essentially the same interactive visual you had in Power BI:
Your goal, however, is not to have the same result. When it comes to just reporting, you should stick to Power BI. However, there are situations where you need much more flexibility. These include situations where you need ad hoc analysis, add or merge data, or do scenario analysis.
Tackling scenario analysis
A convenient and effective way of doing scenario analysis is to link your Excel to PowerPoint. The first step is to connect to the financial data set we connected to in the previous step. However, we will create an Excel table instead of a Pivot Table this time.

You can then build the Excel table from the Power BI dataset.
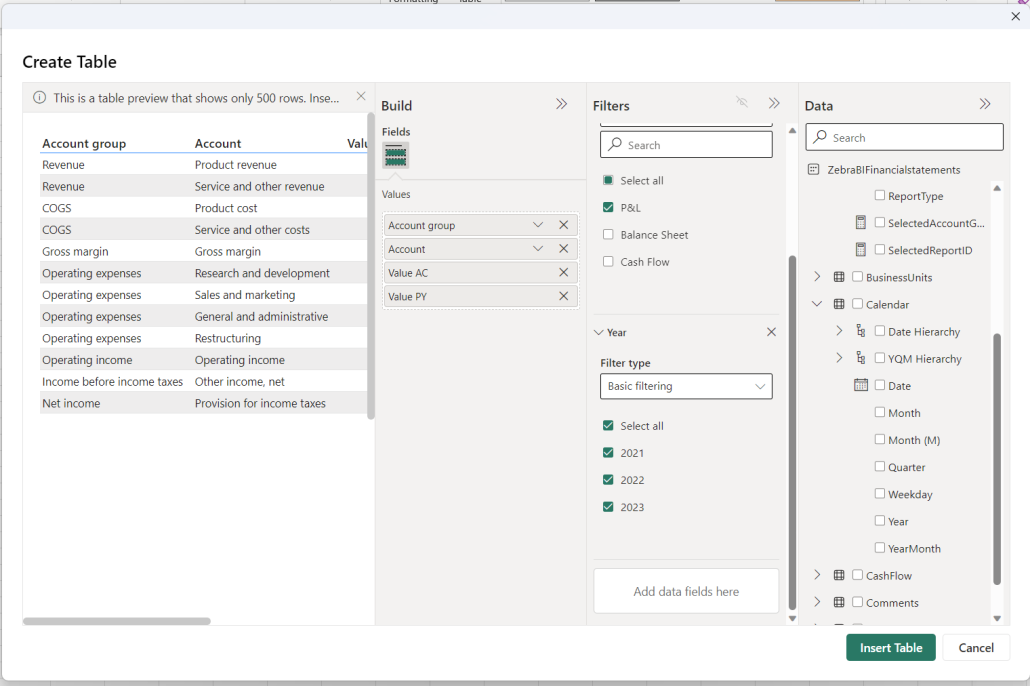
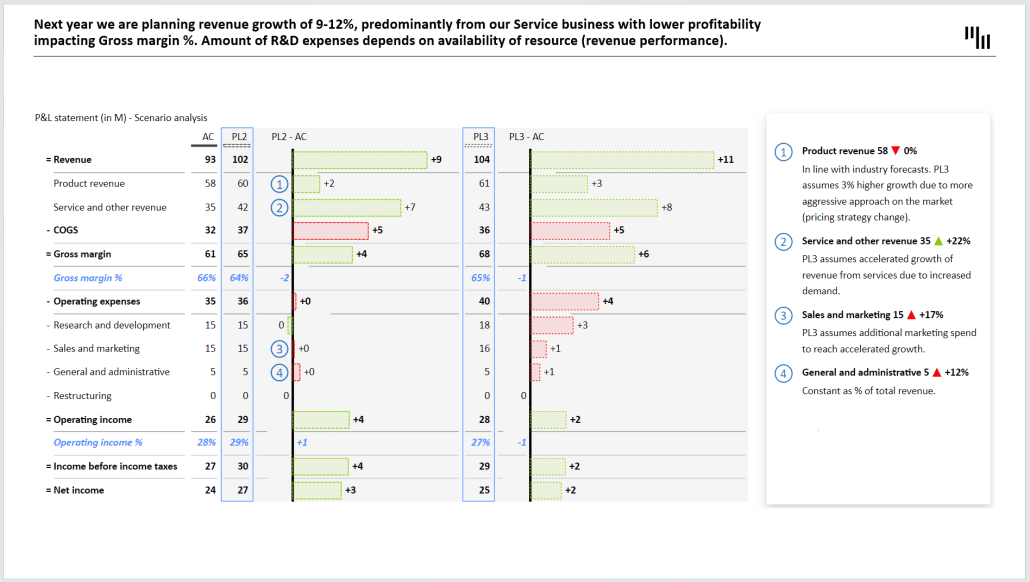
You can select the values and filters you need to analyze. The result is an Excel table connected live to your Power BI dataset. You can add another Zebra BI table for a visual overview of your data based on this data.
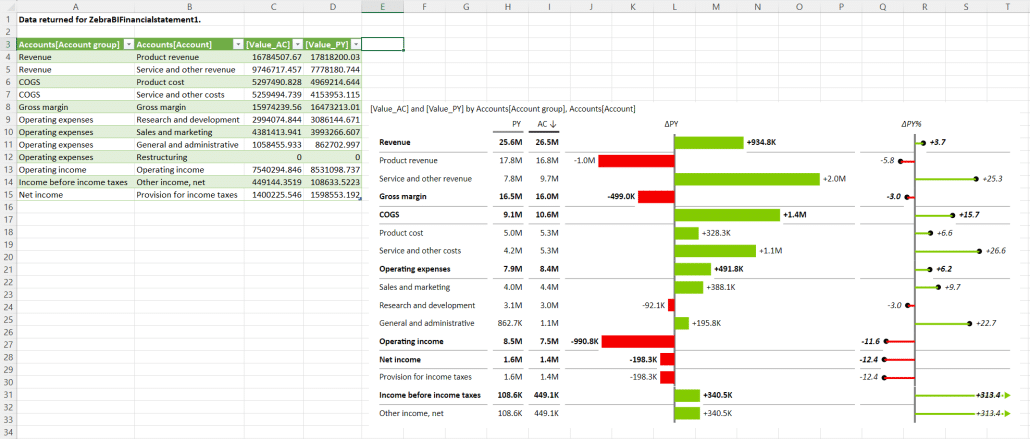
The imported part of the table is connected to Power BI, so it will always have the latest data. However, you can start planning by adding additional data to the table. For example, it's planning season right now, so you can add two columns with plan data.
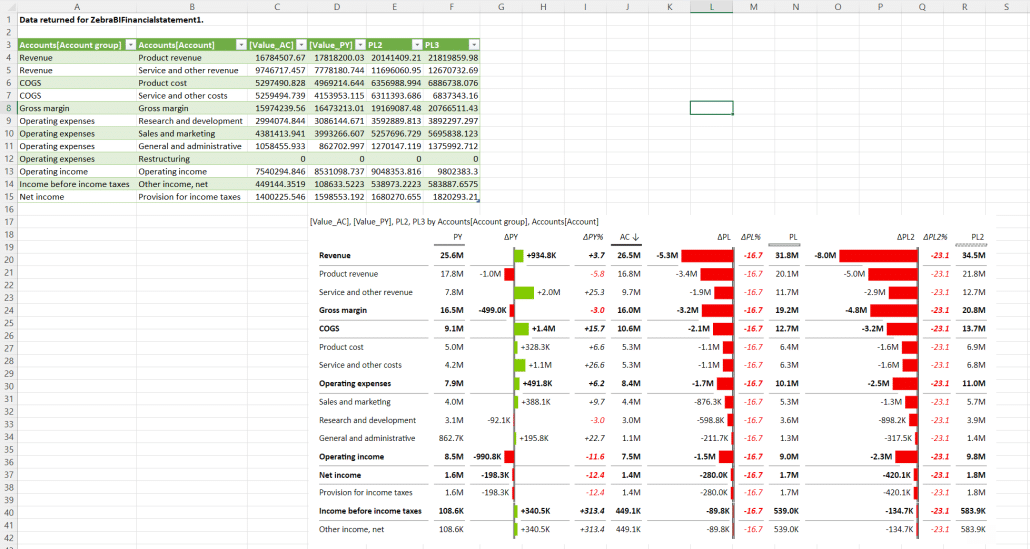
You are now working with a single table that includes your actual results and your plans. This is a really flexible approach because while your actual data remains updated with real data, you can change and adjust your plans whenever you like. Then, you can create new reports, adjust your plans, and keep the cycle of reporting and planning going.
This is what the flexibility of Excel delivers on top of your reporting. The important thing here is you keep the two very important things: one version of truth in your data and consistency of presentation across tools.
This consistency then results in a seamless cross-tool experience that typically ends in PowerPoint.
Moving to PowerPoint
Your priority should be to keep everything linked even as you move to your presentations. Your goal should always be to use updated data without wasting time recreating every presentation from scratch.
You can reuse your Power BI reports in PowerPoint. Open your report, open a page, and share it to PowerPoint.
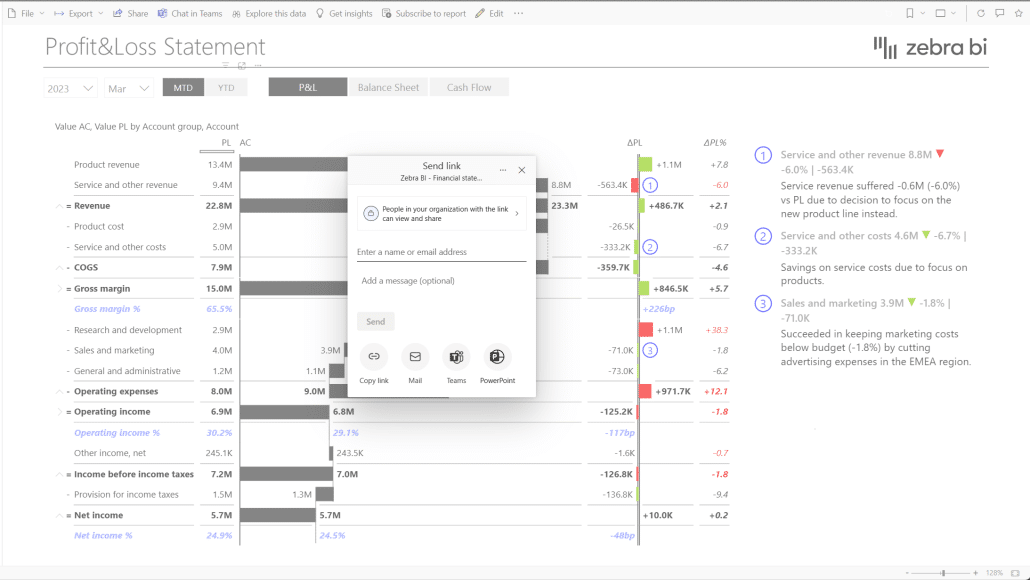
Power BI will generate a slide for you with a live embed of the report that is now running inside your slide. Then, you can cut and paste it into your presentation as a new slide.
This is where the power of our new annotation layer really shines. Embedded reports are fully interactive even in the view mode, and you can use the new commenting functionality to add comments inside PowerPoint. You can do this in a meeting as you present to add additional context provided by other participants.
You can also use Zebra BI for PowerPoint, which is a part of the Zebra BI for Office offering. You can simply link your data to an Excel file and have a live slide inside your PowerPoint presentation. For example, you could import a short P&L statement and expand it when people ask questions to drill down into data.
You can also add comments and explanations in real-time.
This is a completely different flow from what we are used to at the moment. Currently, we are working with static slides that you cannot drill down into and cannot explain the data further.
Zebra Actionable Intelligence
This is where we are right now. Our products provide you with the tools you need to create insightful visuals in seconds. Almost everything is available out of the box, so you don't have to deal with settings and configurations. We believe that tools should take care of creating visuals so you can focus on telling a story.
But we are also looking at the next stage in evolution - AI. We are hard at work embedding AI in our products, and we are calling this actionable intelligence. This is one of the first public peeks at what we are planning.
The first thing to know is that Zebra AI is a standalone service not bound to Microsoft Power BI or Office.
The first thing you'll see when you visit zebra-ai.com is a blank page asking for data.
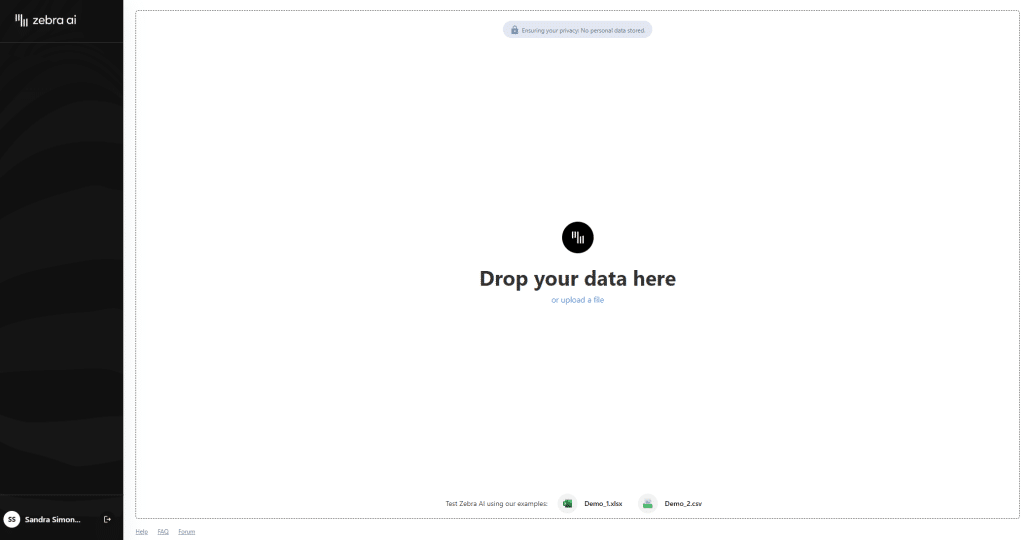
You can upload any type of data from financials, sales, HR, or any other domain. We're importing a sales data file with multiple columns and almost 10,000 data rows for our purposes. Once you upload your data, the system tries to understand what the data is all about and generates a summary.
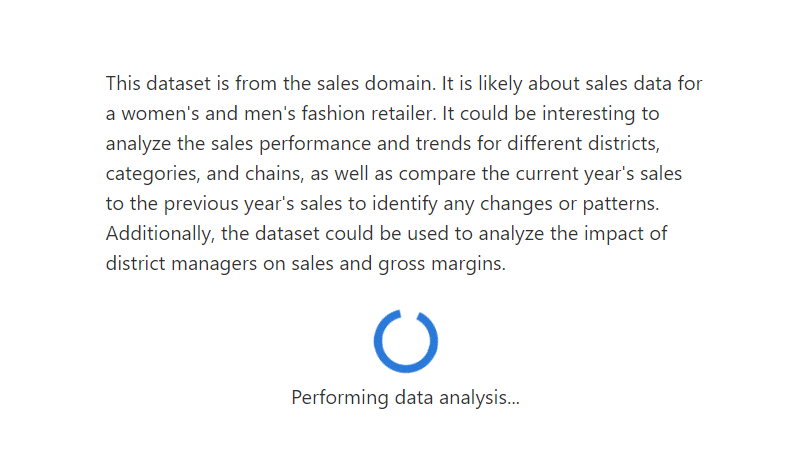
The system tries to interpret the different columns that are found in the data and understand what they mean. It then applies a series of statistical and AI-assisted algorithms to search for interesting patterns.
The next step is going to be what we call explanation analysis. Here, the system tries to understand the patterns it found by drilling down into data. It attempts to filter those interesting data points and analyze them over the other dimensions in the dataset. The goal is to understand why those patterns emerge.
The final step in this process is to plan and design the actual dashboard that the system is going to output with multiple charts.
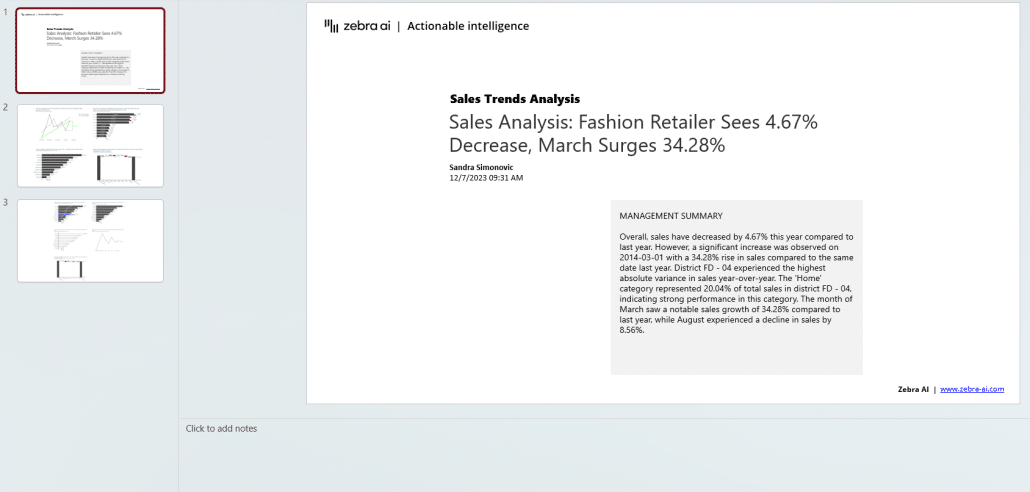
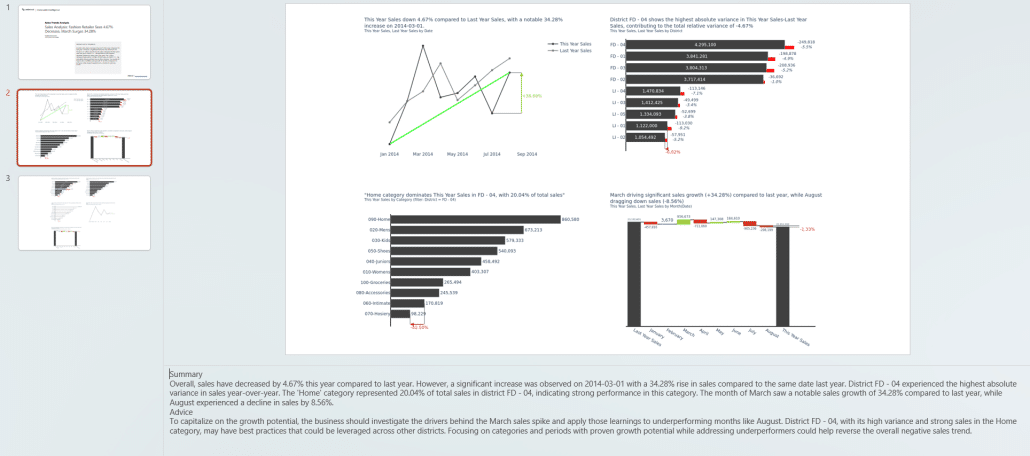
Here is the result:
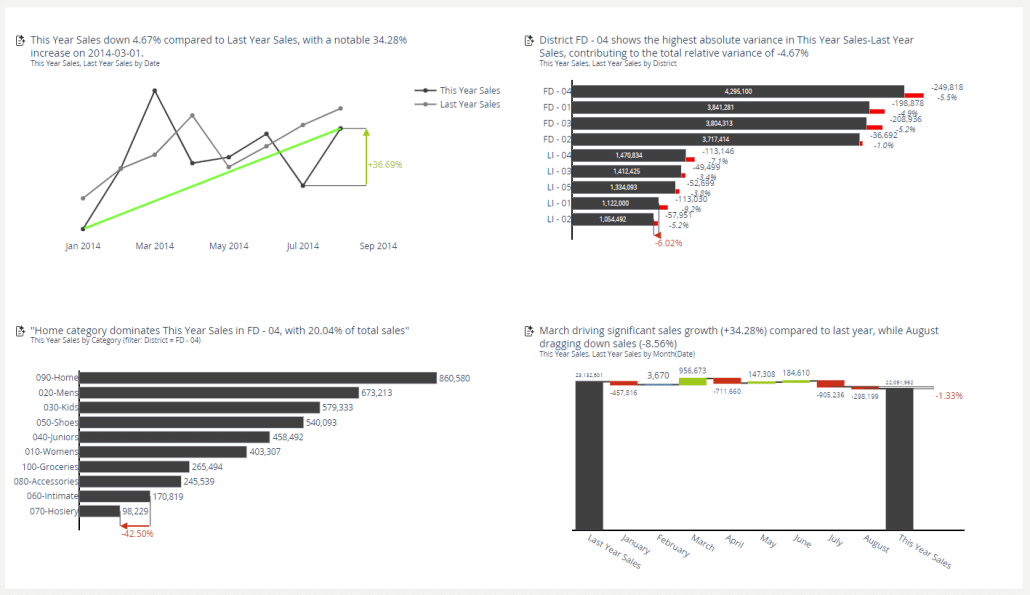
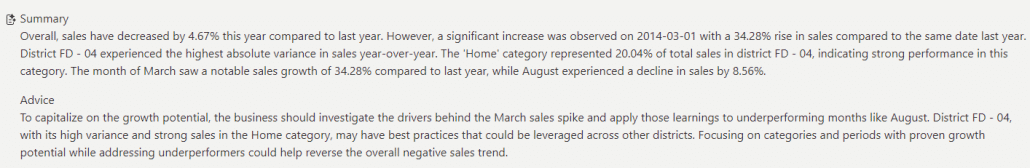
The system automatically generated advanced charts with calculated variances, different types of highlights, and trends. It also generated key messages for individual charts in natural language and the dashboard summary and advice.
The system follows good reporting practices, and it includes a time series plot with trends in the top left complemented by several breakdowns of the sales by different dimensions.
While Zebra BI specializes in advanced data visualization and reporting—enabling users to make better business decisions through clearer insights, particularly in financial and sales contexts—we’ve also explored a few other tools that offer value in adjacent areas of business intelligence and analytics:
At Zebra BI, we specialize in advanced data visualization and reporting, empowering users to make informed business decisions through clear insights—particularly in financial and sales contexts.
In our exploration of complementary tools that enhance various aspects of business intelligence and analytics, we've identified several noteworthy solutions:
- Billo: A user-generated video ad platform that connects brands with real people to create authentic, high-converting video content—ideal for product promotions, reviews, and social media ads that build trust and drive sales.
- Equaltime: An AI-powered meeting assistant that ensures inclusive and productive virtual discussions by tracking speaking time, surfacing engagement insights, and helping teams foster balanced participation in real time.
- Folk: A collaborative CRM built for service-oriented businesses, combining contact management, workflows, and integrations into a single platform to streamline client relationships and boost team efficiency.
- Briefer: A platform for creating dynamic, interactive briefs and reports that combine multimedia content, live data, and collaboration—helping teams communicate updates, strategies, and results more effectively.
- LeadBoxer: A sales lead management platform that identifies website visitors, qualifies prospects with behavioral and firmographic data, and delivers actionable insights to help sales teams prioritize and close more deals.
- Prezent AI: Prezent AI – an intelligent platform that transforms business communication, making presentations smarter, faster, and more engaging.
- SalaryBox – an AI-driven platform that automates payroll, attendance, and compliance, streamlining corporate finance operations for businesses of all sizes.
Each of these tools offers unique capabilities that can complement Zebra BI's data visualization strengths, providing a more comprehensive approach to business intelligence and operational efficiency.
Due to the generative nature of the system, these results might be slightly different each time you run the process.
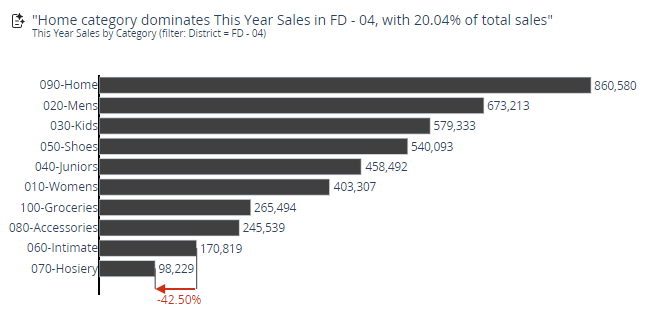
Let's look further into what's happening in one of the charts: "Home category dominates This Year Sales in FD - 04, with 20.04% of total sales."
If we want to discover what happened, we can use Zebra AI's chat interface to easily ask the system why it occurred. The solution actually even proposed this question, so all you have to do is click.
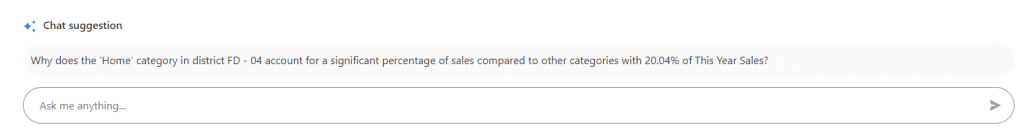
The system will try to perform the most relevant analysis and provide an answer:
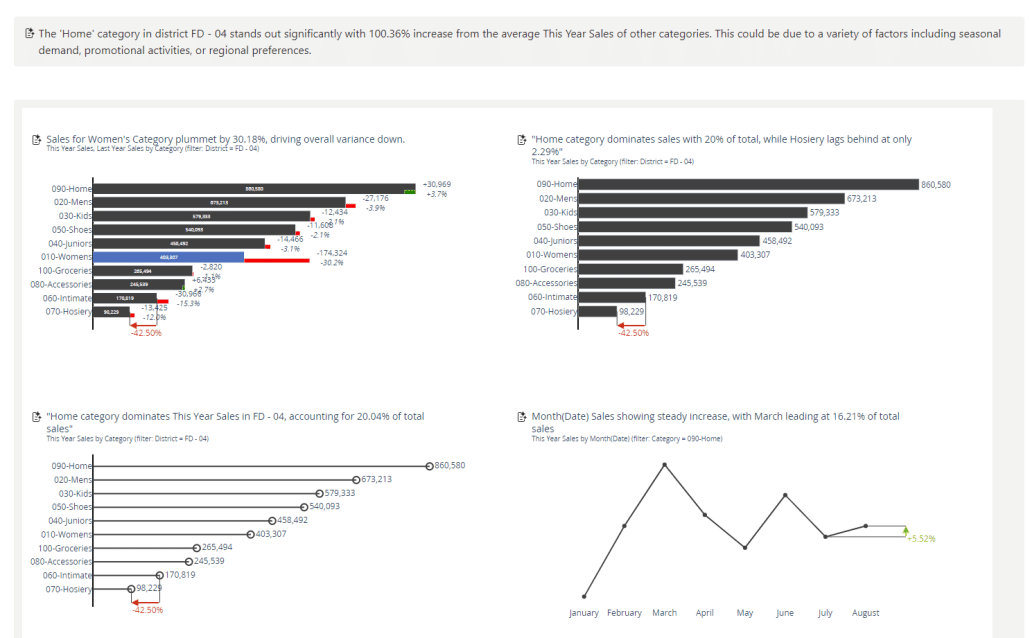
We quickly see that there are several possible reasons for this performance drop. One reason is worse sales at the Fashions Direct store chain.
Once you have your analyses ready, you need to be able to share them with other stakeholders in your company. We're currently exploring different ways of doing that, and we believe that it would be great if the system created a PowerPoint presentation for you.
All you need to do is click this button:
This will generate a PowerPoint presentation that comprises a title slide with an AI-generated title and executive summary, as well as slides with dashboards and charts.
Automate your data models
One of the great things about Zebra AI is that it can perform certain tasks independently. For example, if you load a dataset that contains sales data for years from 2021 to 2023, the system can automatically set data as the previous year and compare them to actual data for the current year.
It also creates a proper calendar dimension so that monthly or quarterly charts can be drawn and displayed correctly. This way, it generates a complete data model with calendar dimensions and time intelligence, a significant time saver.
Ensuring meaningful results are generated
One thing that people who see generative AI in action will be concerned about is hallucinations. These are wrong inferences and conclusions by the AI that sound credible but are not actually true.
Zebra BI is employing various strategies to tackle this issue. For all drawn charts and data operations, we use strict logic, data manipulation algorithms, different statistical analyses, and other tools to ensure that the charts and the data are factual and not hallucinated.
You can click on an icon next to a chart and see the calculations, the groupings, the aggregations, and the filters that were applied to arrive at that final data slice that was visualized.
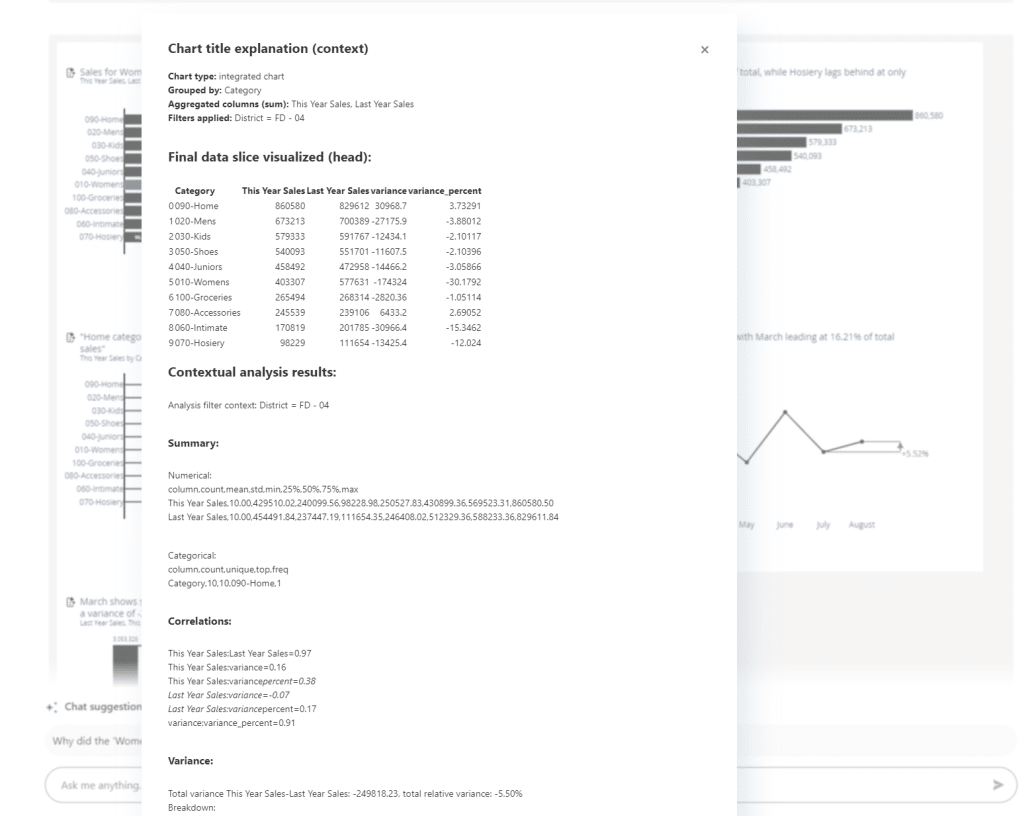
Zebra AI works with a multilevel agent that uses statistical analysis, generative AI, and other tools to ensure that the reasoning behind its visuals and conclusions is correct and that a meaningful result is produced.
Connecting to other data sources
Currently, Zebra AI supports Excel and CSV files. We are planning to expand this and support multi-table data sets in the future. As for data sources, the goal is to support different sources. While our number one priority is Power BI data sets, we also plan connectors to different services, databases, data lakes, Databricks, BigQuery, and others.
Data security
Zebra BI is committed to the responsible use of AI and customer data. Uploaded data is not used to train AI, and it is only stored temporarily for the duration of the session. It is located in a secure environment in the Microsoft Azure cloud.
This means data is only used to generate the output and is not stored long-term.
AI is the future
For years, we have touted the benefits of actionable reporting, and we believe that we are getting to the point where consistent and understandable visualization has become automated enough to allow business users to focus on insights and the stories told by the data.
With generative AI tools, we are getting even closer to that vision. Actionable intelligence will take this concept further and generate basic insights while taking the guesswork out of visualization. This will free decision-makers to focus on deep analysis and take meaningful action.
Watch the full live event:
Zebra BI is leading the charge in data storytelling with its innovative use of AI. Their focus on actionable intelligence ensures that reports are not only clear but also dynamically insightful. Integrating tools like Power BI and Excel seamlessly, Zebra BI's upcoming features promise to elevate how we present and analyze data. Exciting times ahead!
We couldn't have said it better ourselves! Thank you for the kind words, we always appreciate the feedback we are getting! Also, you might want to check out our next AI live event.
Zebra BI's approach to simplifying data storytelling with AI integration is exciting. The focus on clear, actionable reports and consistent design is crucial for making data-driven decisions. I particularly appreciate the emphasis on avoiding cluttered dashboards and prioritizing clarity. This streamlined approach will help businesses unlock more value from their data!
Thank you for your kind words! We're glad you value our focus on clarity and actionable insights. Simplifying data storytelling is at the heart of what we do, and your feedback inspires us to keep innovating.