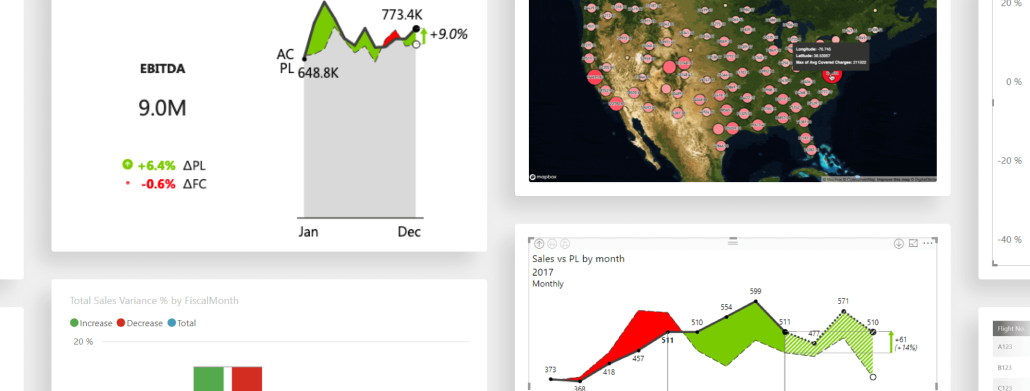
It has never been this easy to visualize and tell stories with your data. We'll focus on some built-in and custom visuals to make your reports more actionable.
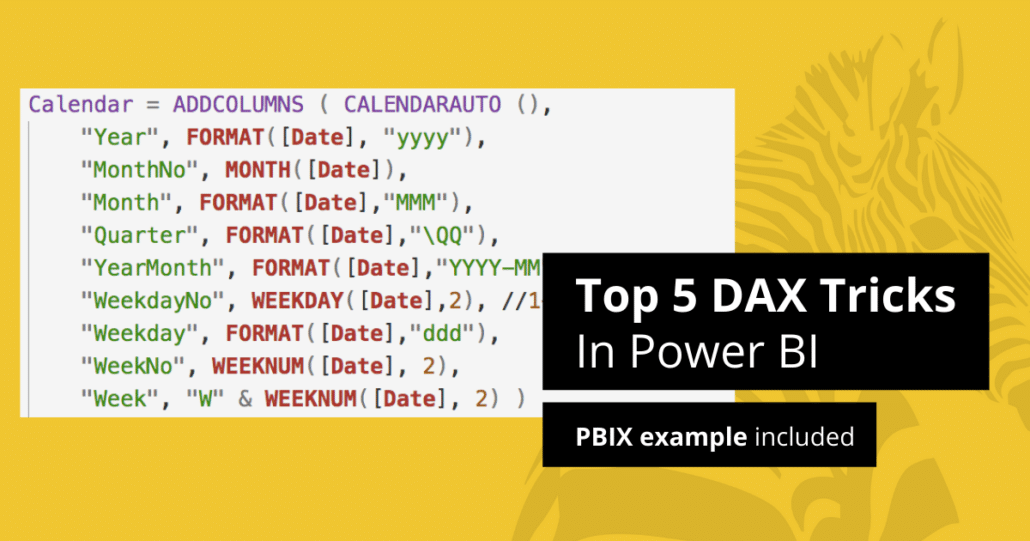
We will share some of DAX modelling best practices and tricks which you can use for faster creation and easier maintenance of your dashboards and reports.
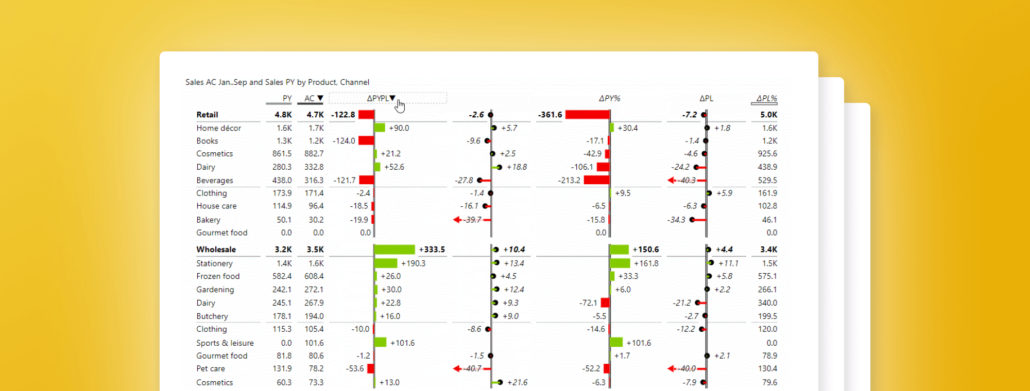
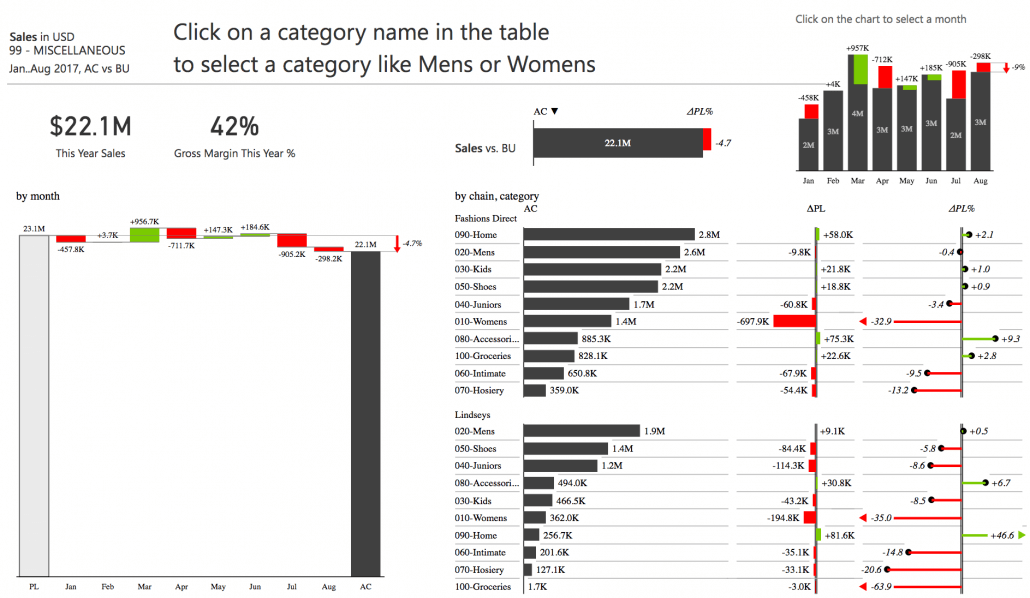
Power BI is a powerful tool for analyzing and visualizing data, but it falls short in some areas. Find out how Zebra BI visuals can make your life easier.
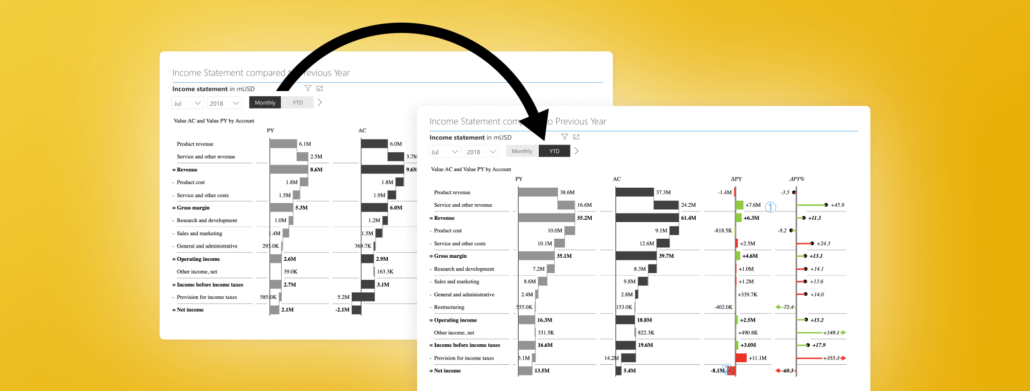
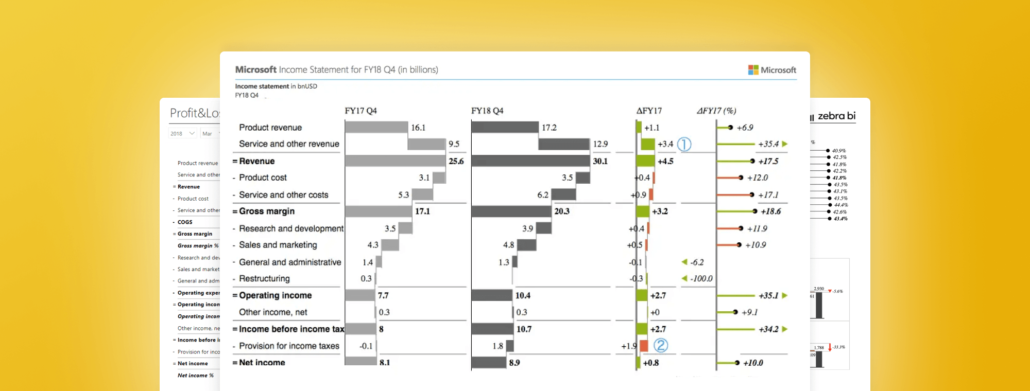
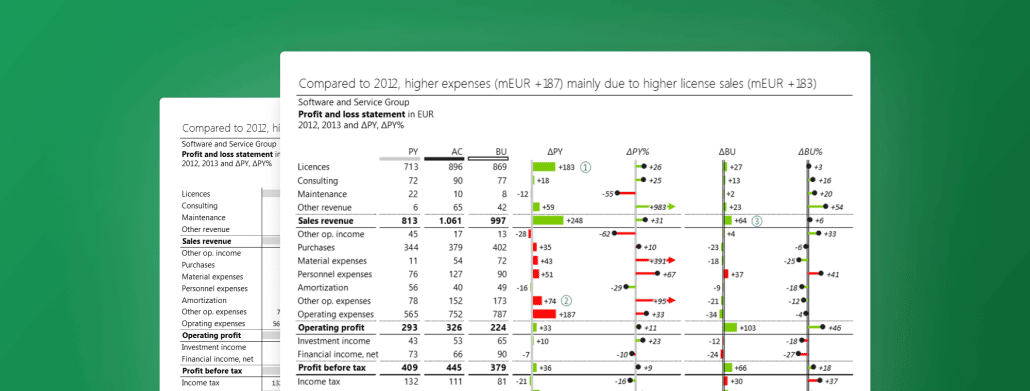
If there is one report that's a business constant, it's the income (profit & loss) statement. Learn how to create an actionable income statement in Excel
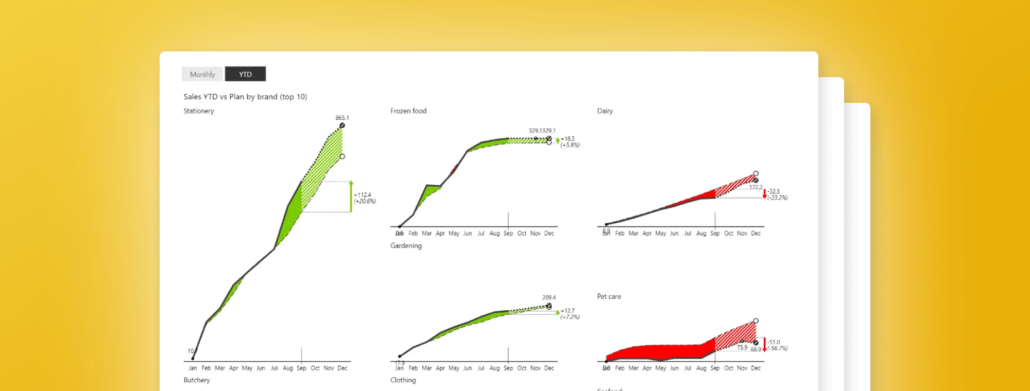
Learn a powerful method for building advanced Power BI dashboards which are compatible with different platforms, fully responsive and easily shareable.
 September 8th
 February 22nd