Mastering Variance Reports in Power BI
In this webinar, we will analyze and explain the most effective methods for presenting variances in Power BI dashboards and reports.
Wat je leert:
Presentator


Founder & CEO at Zebra BI
Andrej brings 25 years of experience in business intelligence and software development and 20 years as a consultant. Helping numerous international and regional companies achieve consistent and efficient internal reporting throughout the organization inspired him to build Zebra BI.
What are the most effective ways of presenting variances in Power BI?
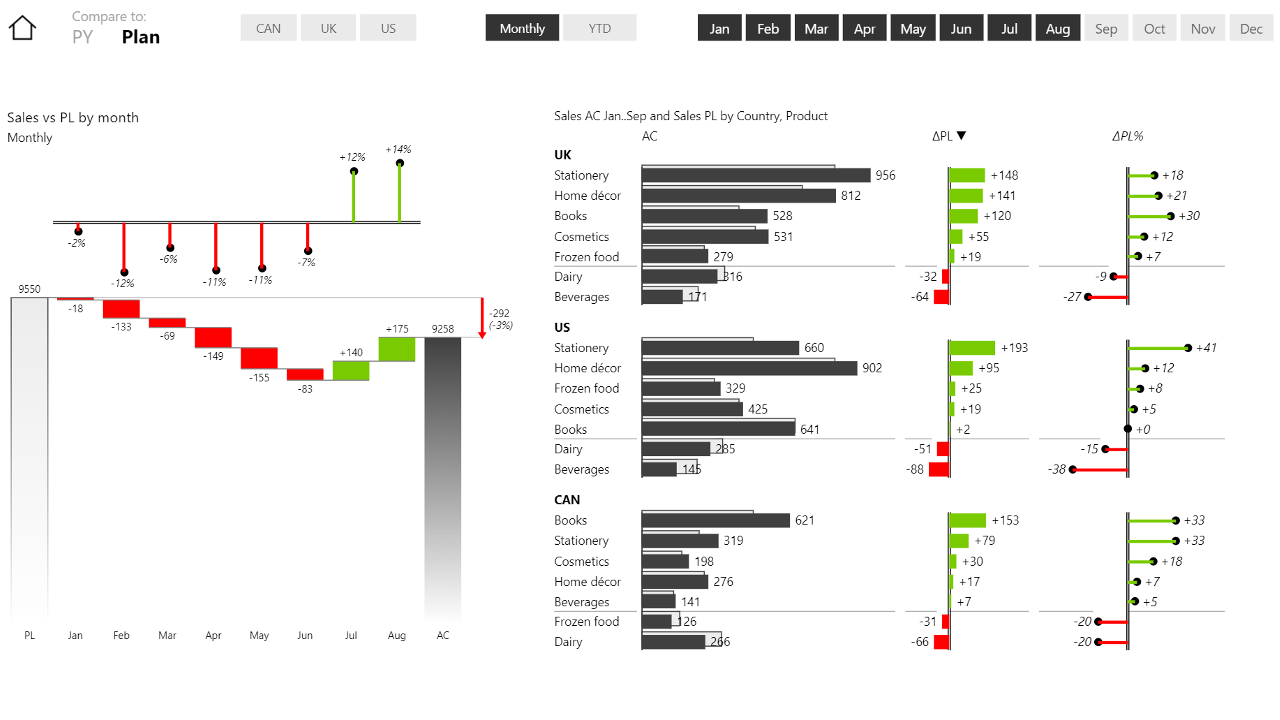
Presenting sales vs. plan, cost vs. budget or comparing income statements to PY in a clear and understandable way is the most critical part of a professional business report or BI dashboard.
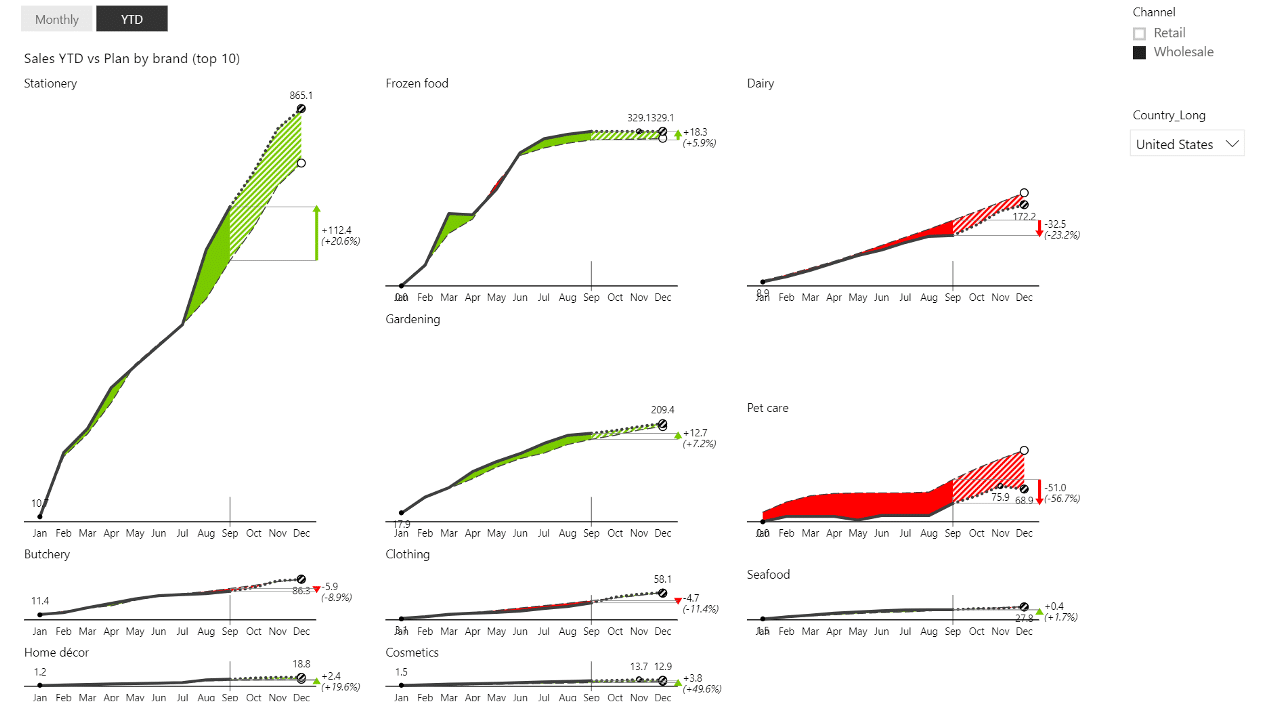
Our host Andrej Lapajne, CEO and Founder of Zebra BI, will present some advanced ideas, e.g., adding forecasts to your dashboards, presenting YTD values versus monthly values and so on. We'll also hand out the new Zebra BI custom visuals for Power BI to all webinar participants!
Bekijk op aanvraag
Watch the video
Zebra BI-webinars zijn al bezocht door meer dan 10.000 deelnemers!