Automating Excel reports with PivotTables and slicers
Join our webinar to learn how PivotTables, slicers and other functions let you automate your reports and dashboards in an extremely efficient way.
Wat je leert:
Presentator


Founder & CEO at Zebra BI
Andrej brings 25 years of experience in business intelligence and software development and 20 years as a consultant. Helping numerous international and regional companies achieve consistent and efficient internal reporting throughout the organization inspired him to build Zebra BI.
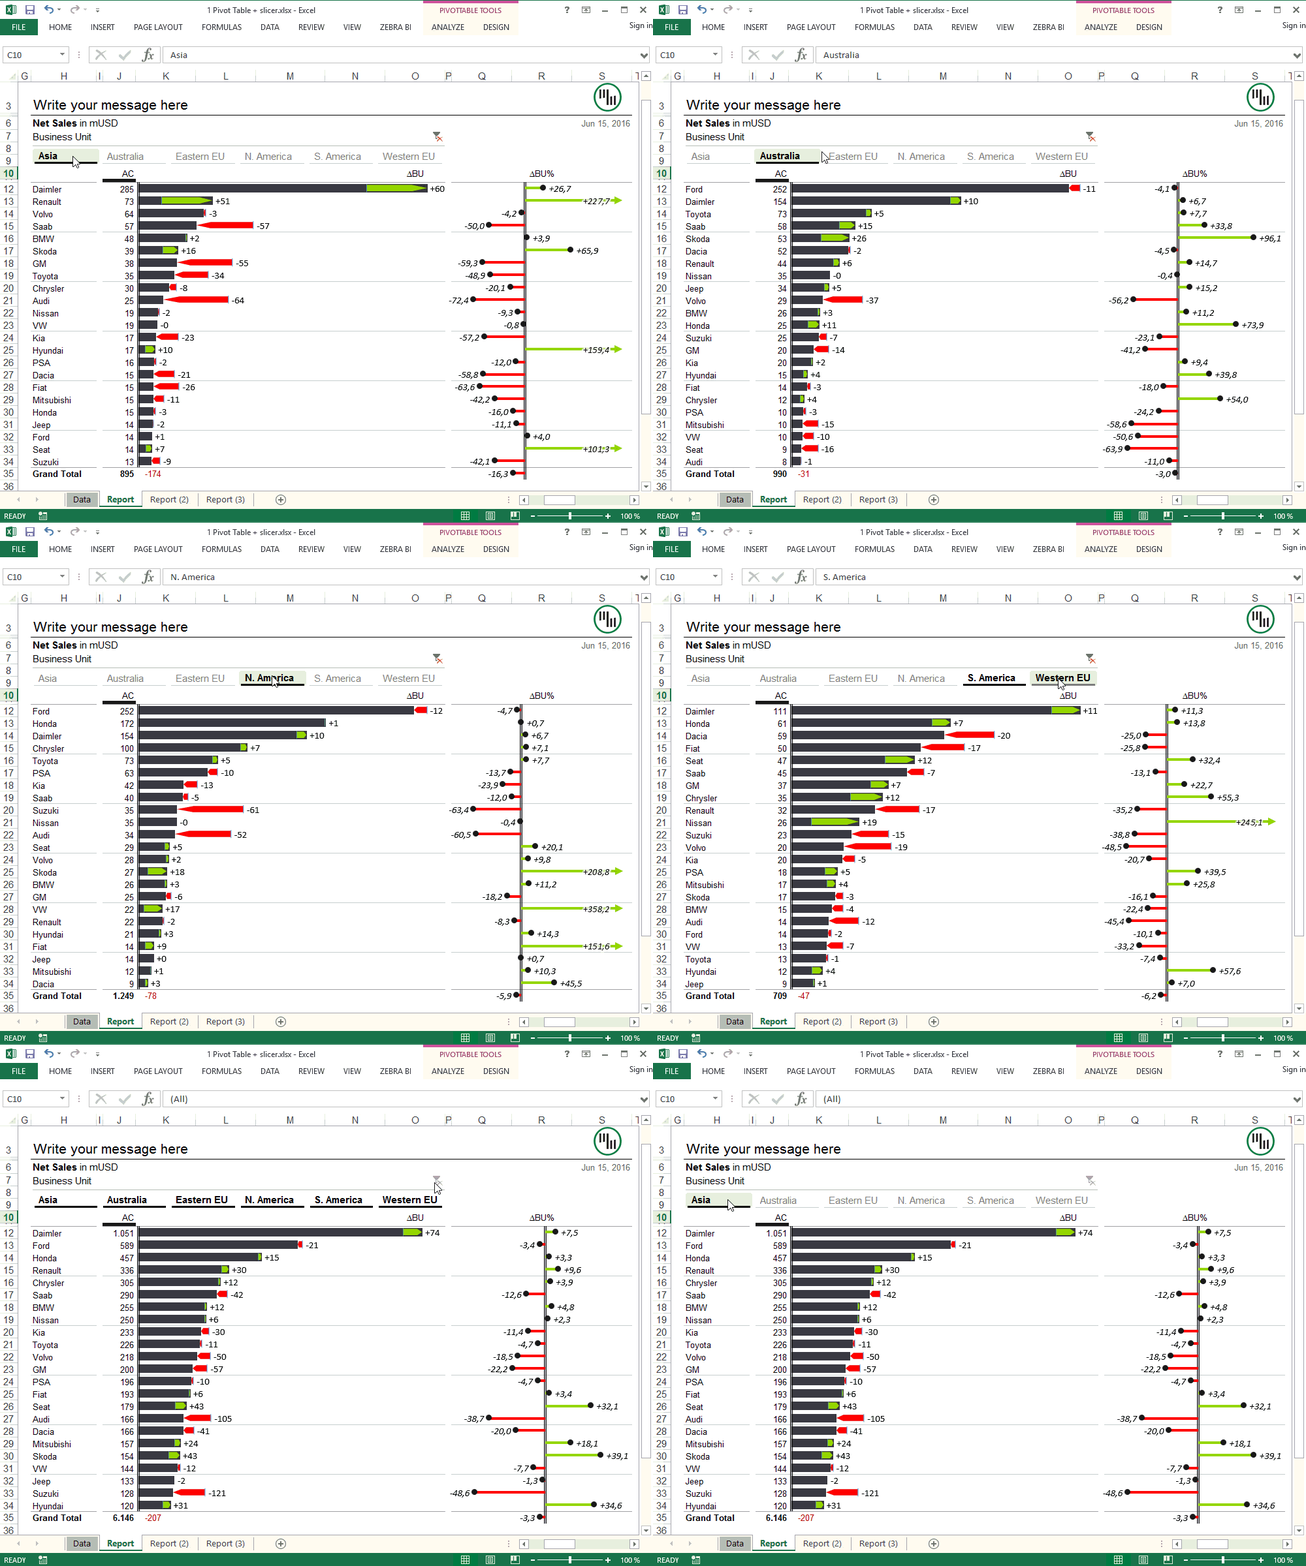
Create updatable and interactive reports and dashboards!
Updating your monthly, weekly and daily reports in Excel can be a tedious task that involves lots of copy&pasting, formula adjustments, etc.
It's also the #1 source of errors in business reports. That is if you're doing it manually.
Our host Andrej Lapajne, CEO and Founder of Zebra BI is here to guide you through PivotTables, slicers and other functions that let you automate your reports and dashboards in an extremely efficient way. Watch the webinar to learn more!
Bekijk op aanvraag
Watch the video

Zebra BI-webinars zijn al bezocht door meer dan 10.000 deelnemers!