Share this
The Definitive Guide to Income Statements in Power BI


In this webinar, we will tackle all the challenges and provide tips&tricks to structure, create, and design understandable and actionable income statements with the help of Zebra BI visuals for Power BI.
You'll learn:
Presenter


Founder & CEO at Zebra BI
Andrej brings 25 years of experience in business intelligence and software development and 20 years as a consultant. Helping numerous international and regional companies achieve consistent and efficient internal reporting throughout the organization inspired him to build Zebra BI.
How to create income statements for 2020?
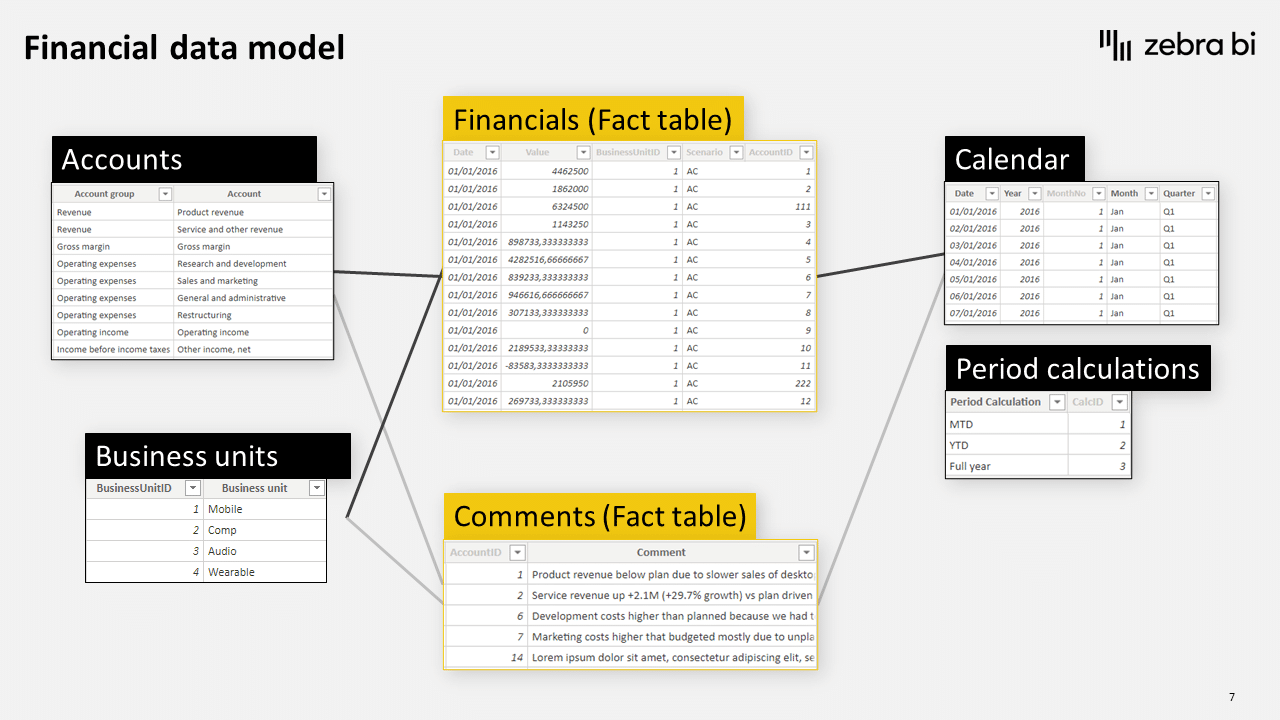
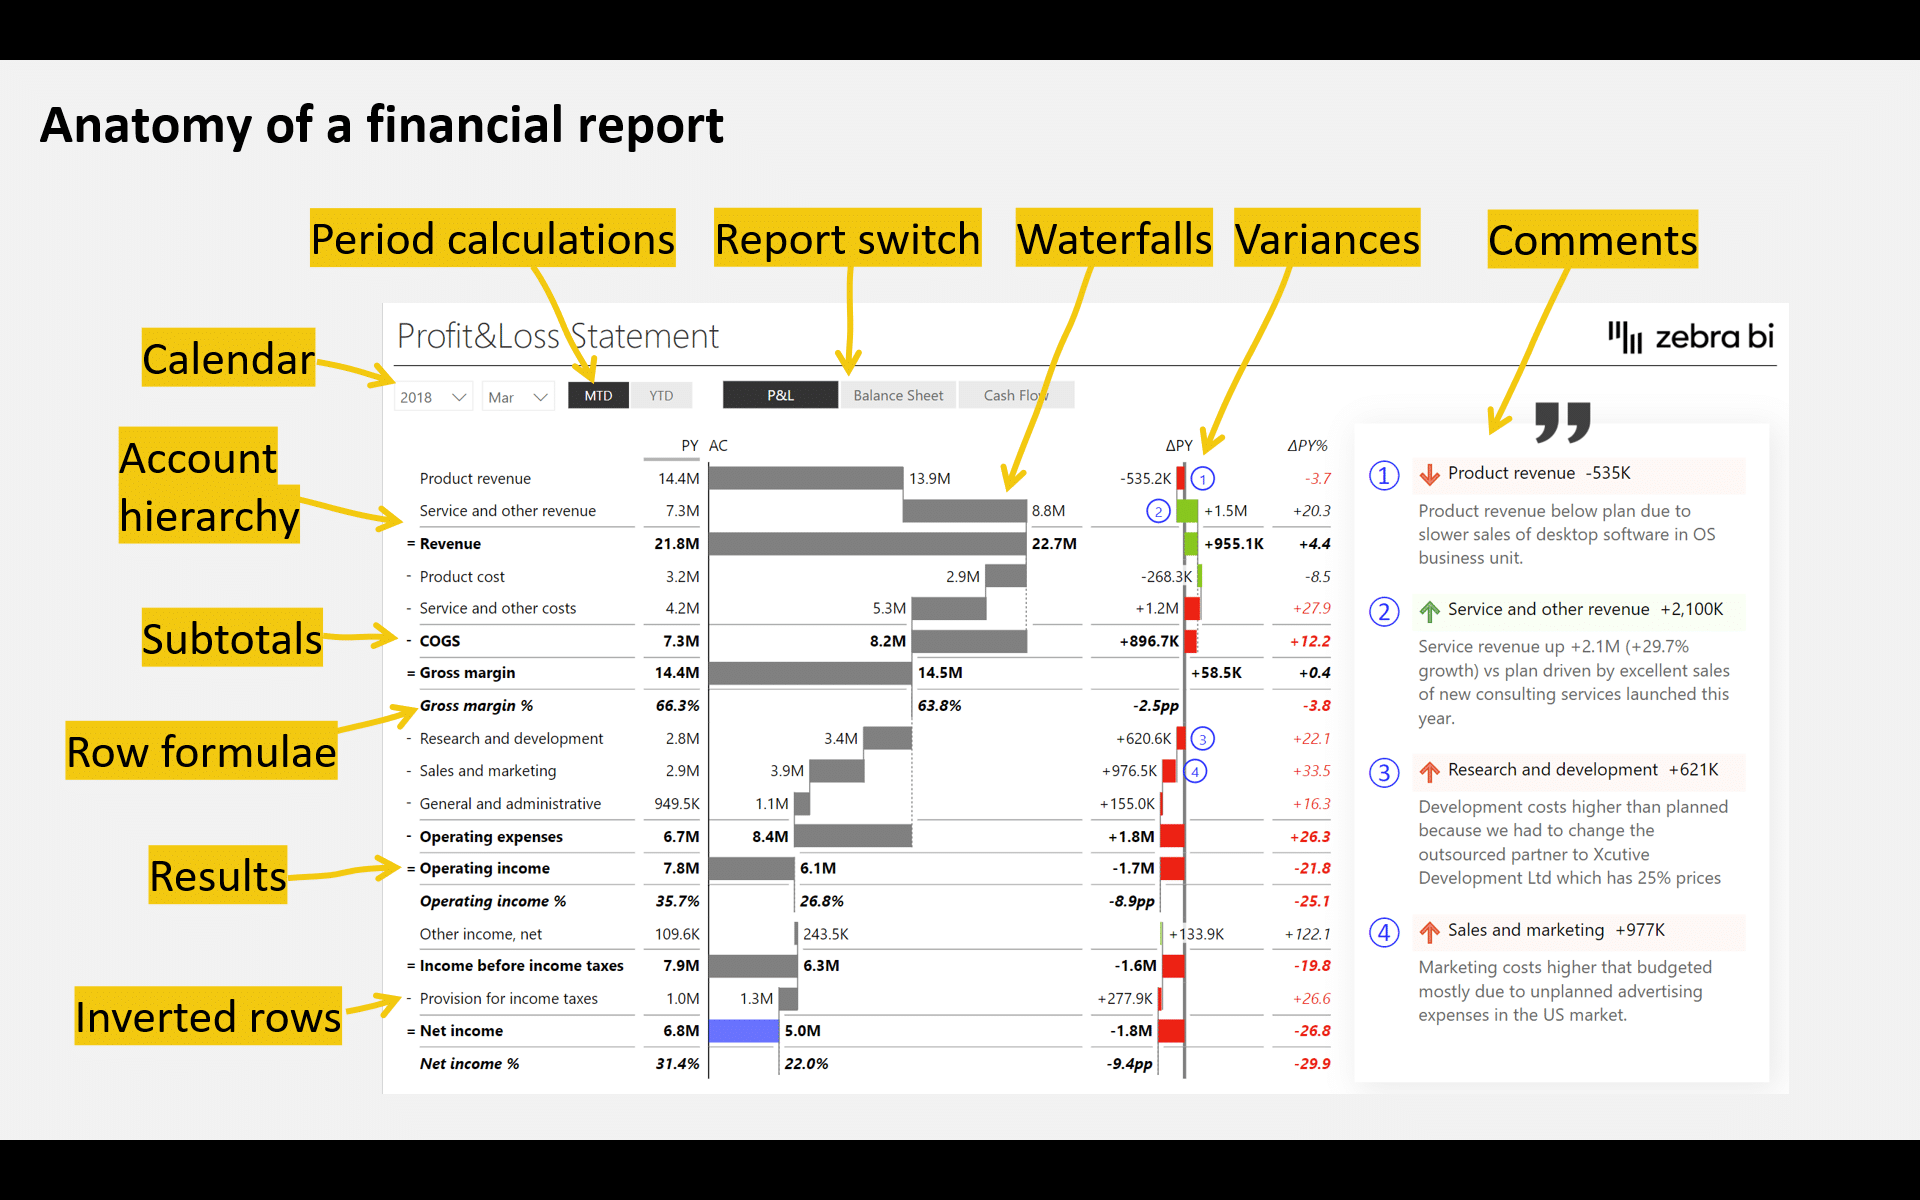
An income statement (or a Profit & Loss statement) is one of the three key financial reports, along with a balance sheet and cash-flow statement. It provides the ultimate view of your company’s financial performance.
Still, creating income statements in MS Power BI can be nightmarishly difficult. Datasets are hierarchical, containing several intermediate results and subtotals, consist of both “good” and “bad” elements (e.g. revenues vs expenses), requires inserting additional performance indicators (e.g. percentages like Gross Margin in %, Operating income as % of Revenue), etc.