Share this
Improve your Excel reports with visual highlights


In this webinar, we will show you how Zebra BI helps you to improve your Excel reports by adding visual highlights with just one click!
You'll learn:
Presenter


Founder & CEO at Zebra BI
Andrej brings 25 years of experience in business intelligence and software development and 20 years as a consultant. Helping numerous international and regional companies achieve consistent and efficient internal reporting throughout the organization inspired him to build Zebra BI.
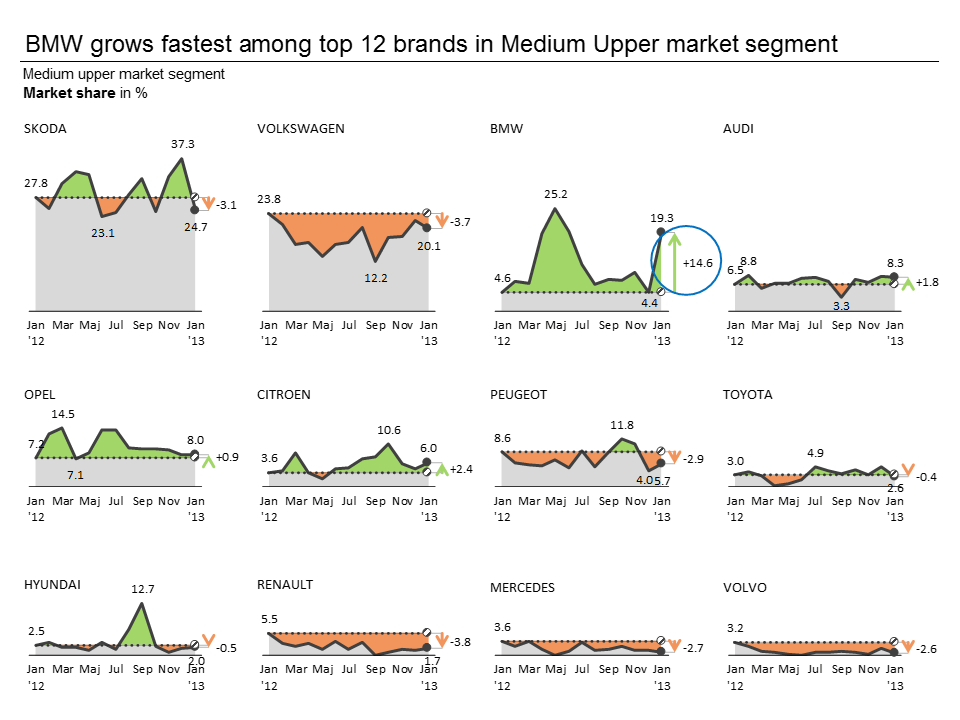
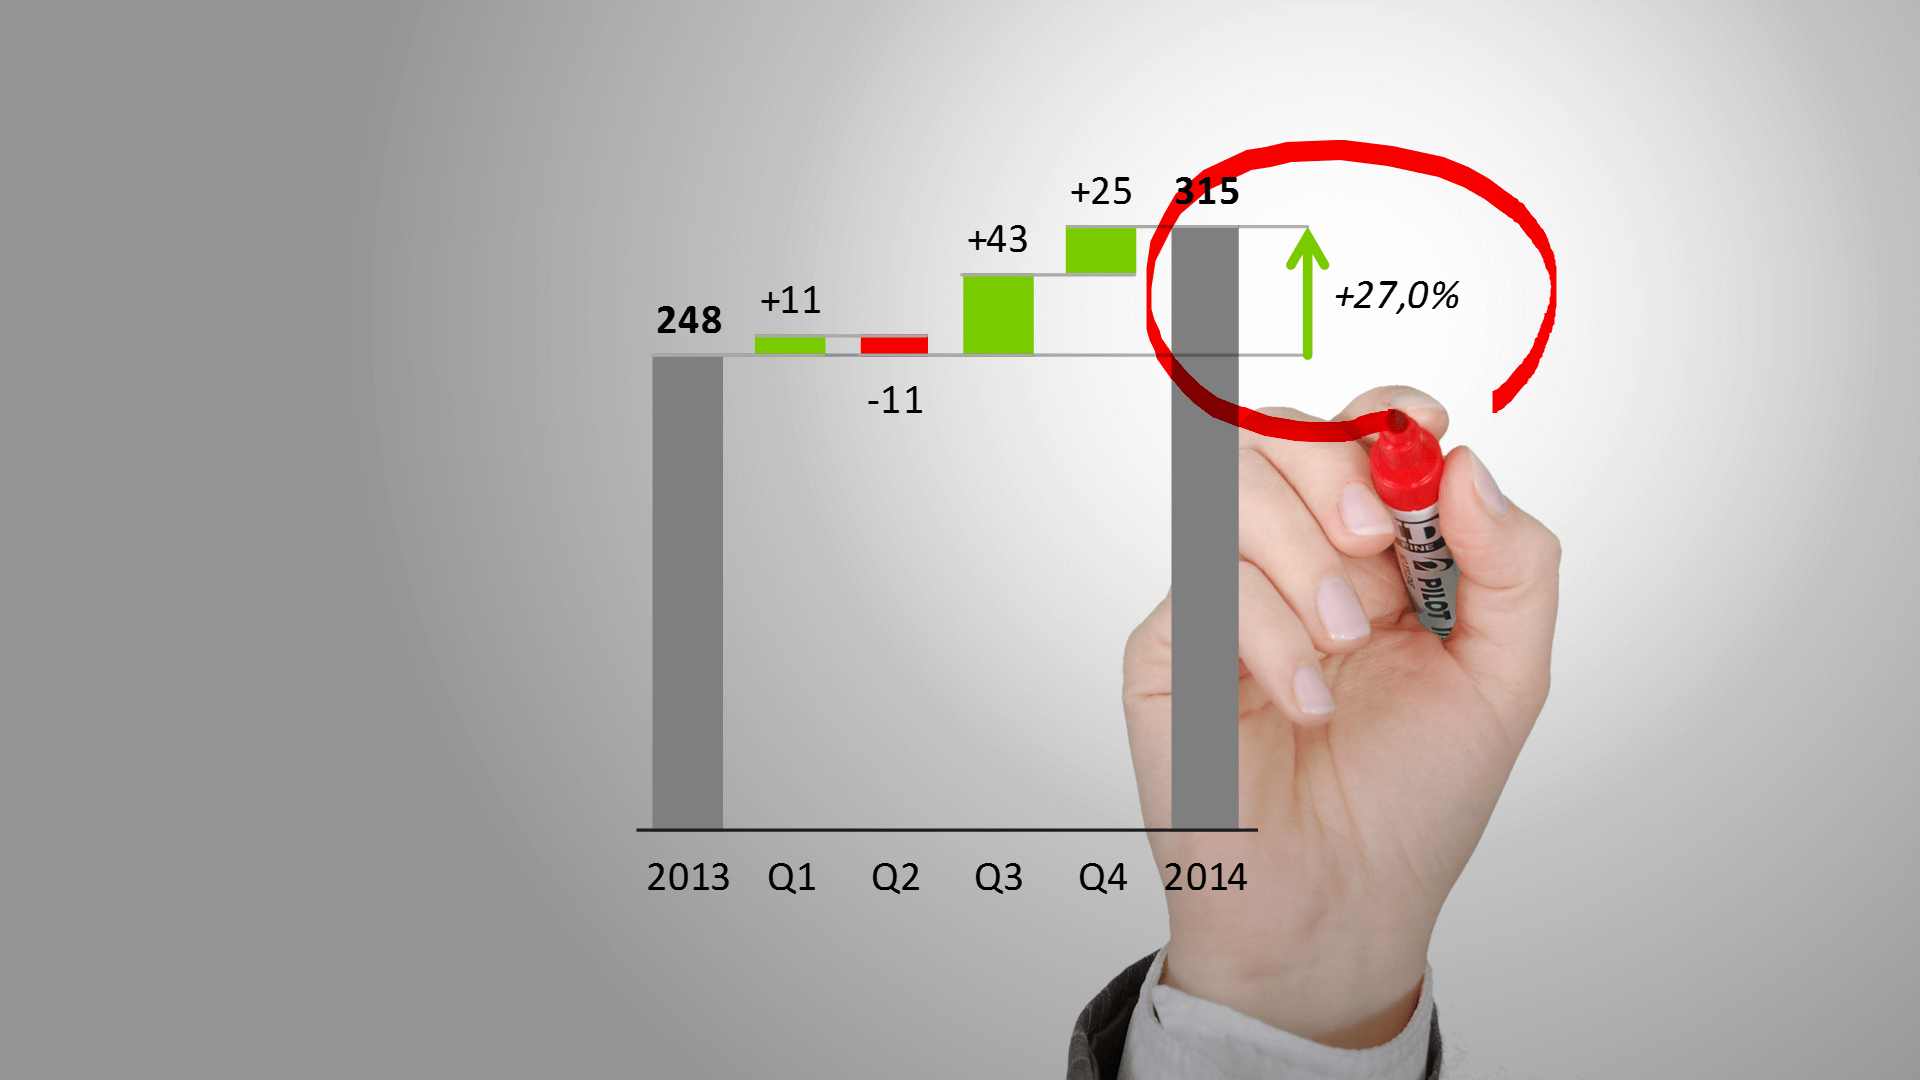
Learn all about row/column highlights and difference highlights
The goal of visualizing data with charts is to bring clarity to the readers and decrease the time it takes them to get the key piece of information from the data. The ideal tool for this are visual highlights. They allow you to present your Year-over-Year growths, plans for the next year, forecasts etc.
Unfortunately, inserting highlights in Excel is slow and complicated. However, Zebra BI is here to help you solve this problem with just one click!💪