Share this
Must-Know Tricks For Interactive Excel Dashboards in 2023


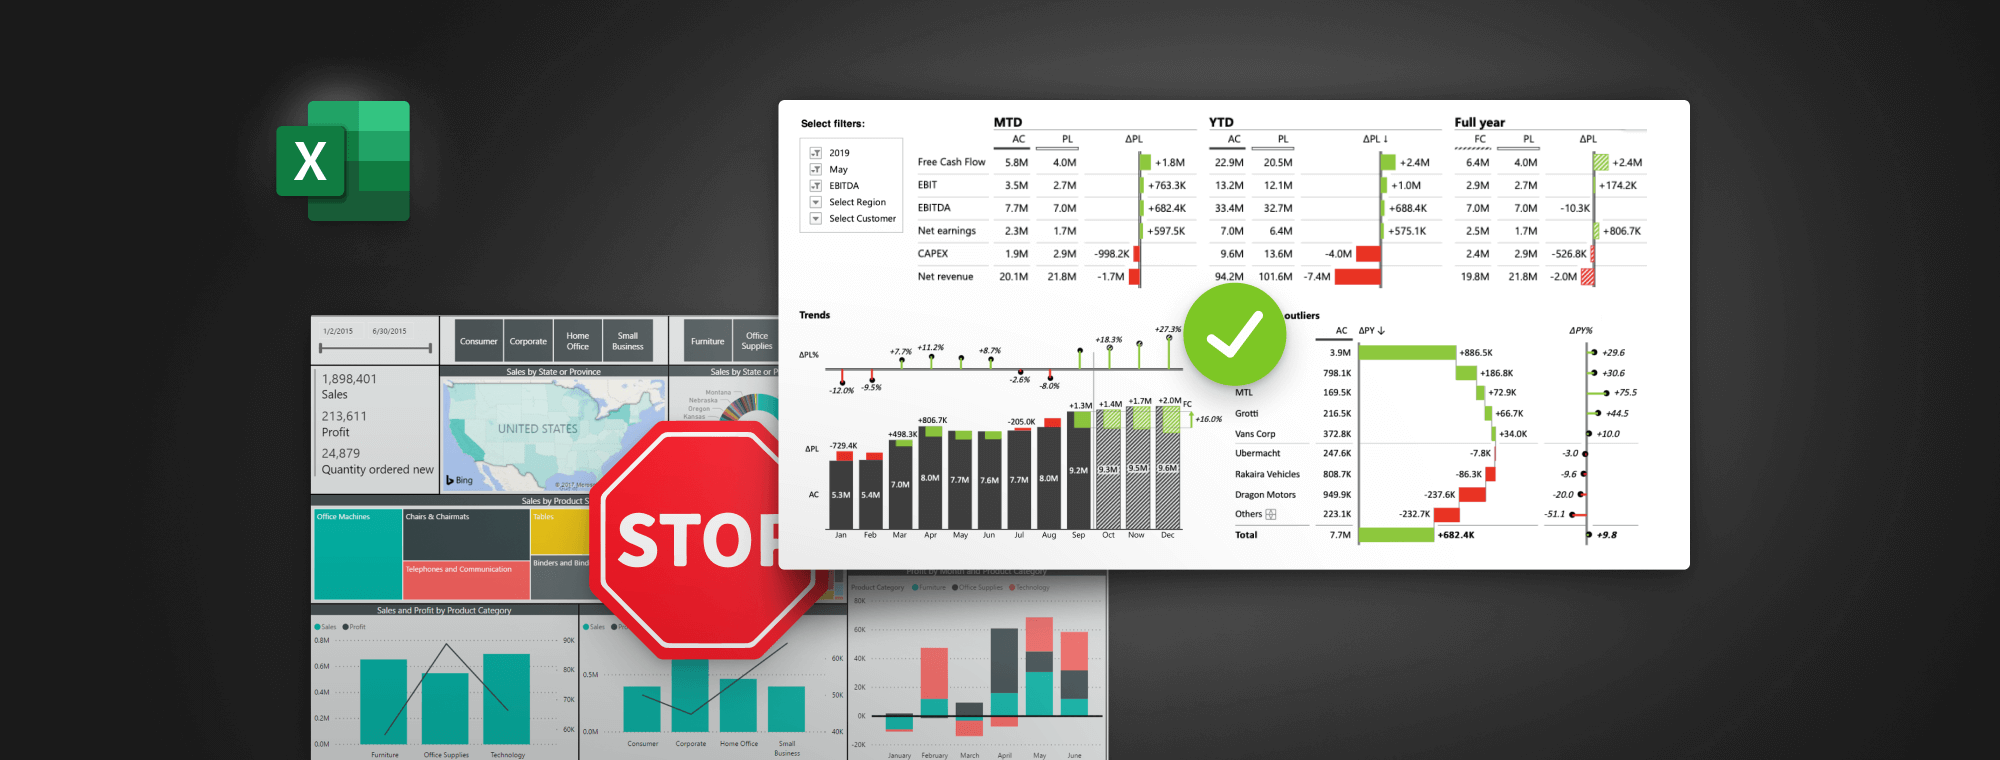
Excel dashboards need to present key business information at a glance.
Yet, the data is still hidden under a bunch of colors, illegible tables, treemaps, pie charts, and other visualizations that do not bring the desired outcome: actionable insights.
But in 2023, that is simply not enough anymore. In the fast-changing business environment, it is crucial to always have the right data available.
Whether you’re a data analyst, finance pro, consultant, or Excel enthusiast, this live webinar will show you practical tips on creating interactive Excel dashboards that show insights immediately.
No theory. Only real-life tips & tricks that you can implement immediately.
You'll learn:
Presenter

Founder & CEO at Zebra BI
Andrej brings 25 years of experience in business intelligence and software development and 20 years as a consultant. Helping numerous international and regional companies achieve consistent and efficient internal reporting throughout the organization inspired him to build Zebra BI.
Bring modern Excel to your reporting
The new business environment continues to present challenges and having the right data available is more important than ever.
To understand this new era of analytics and leverage the latest best practices, there are trends you can’t afford to ignore. The ability or inability to adapt to these shifts can seriously affect whether you stay ahead of the competition in 2023.
Despite many BI tools out there, many business reports are still done in Excel because millions still use it for its flexibility and power. However, this can lead to many fancy charts and a bunch of colors that simply do not add up to the final goal: immediate insights.
But managers need them for making informed decisions fast. They rely on your analysis for it. After this webinar, you will know how to create an interactive Excel dashboard that will immediately answer key business questions.
- What's our sales performance compared to the plan?
- Which business categories are doing the best?
- Where do we need to focus our attention?
- Are we spending more than last year and how much more?
In the end, you will be able to transform your Excel dashboards with the latest reporting best practices, such as small multiples from pivot tables, slicers, advanced waterfall charts, and more!