







Live In
Save my spot

Make your Power BI reports a two-way conversation

Launch Event
. · . - .
Introducing Zebra BI Tables+ and Zebra BI Charts+. Report viewers add comments right on the data, in view mode, with no edit access.
We're not going to describe it. We're going to show it live, on a real report.
Mark Leskovsek Zebra BI - BI Specialist
LIVE WITH ANDREJ LAPAJNE & MARK LESKOVŠEK
Registration closes in:
Register for the launch event
Free to attend. 45-minute live demo followed by audience Q&A.

The people with the answer usually can't add it to the report

What you'll take away
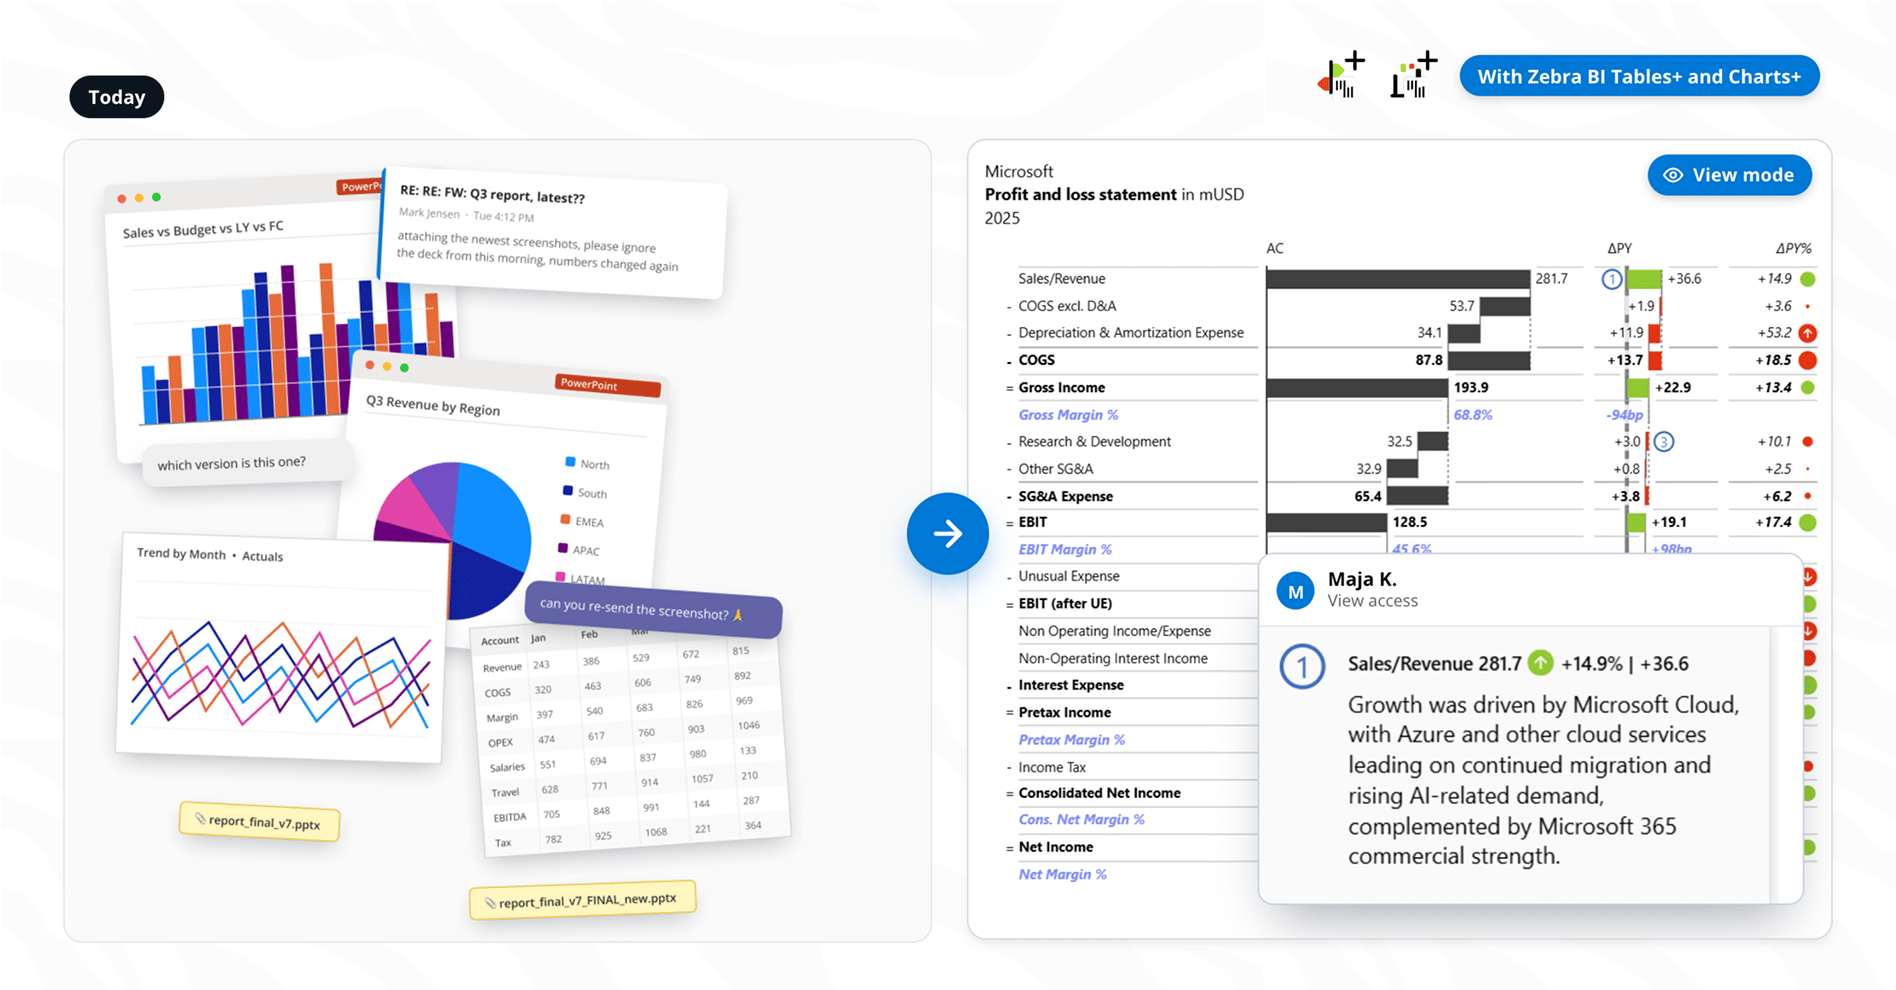
The collaboration gap is real. A regional manager knows why a variance in their region happened, but the report isn't theirs to edit. So the context lives elsewhere, detached from the number. The why and the what next leave the report and get lost.
Zebra BI Tables+ and Charts+ close the gap. Report viewers can now add comments directly on the data point, in view mode, with no edit access needed. Explanations live with the data, governance isn't compromised, and the right decisions get made.

What you'll see

THE LIVE DEMO
Everything below happens live, on one real report.

Viewer commenting, no edit rights

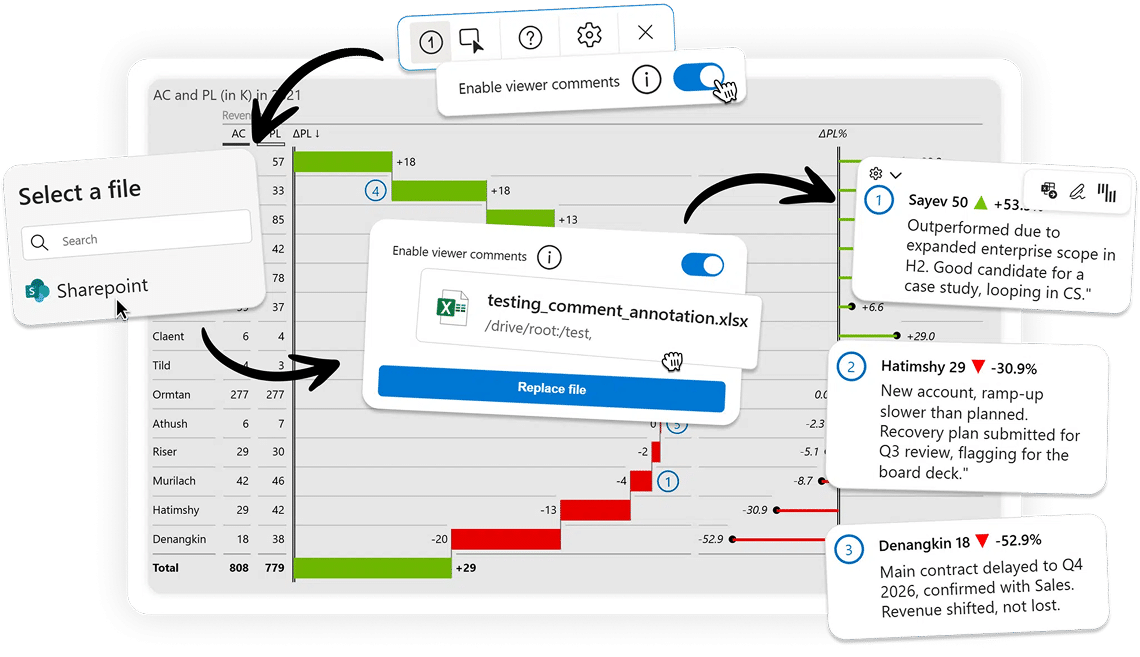
A comment pinned straight to the number, in view mode. Nothing else in Power BI does that.

The workaround, gone

No screenshot, no email, no Teams ping. The context now lives on the data.

Governance that sticks

Power BI permissions stay intact, comments live in your own Microsoft 365, and Zebra BI stores nothing.

Better decisions, less waste

No screenshot, no The context sits right on the number, so teams decide on the full picture instead of chasing it. Faster, better informed, less money spent.email, no Teams ping. The context now lives on the data.

Connect. Comment. Act.

HOW IT WORKS
Step One

Connect

Link a SharePoint file to your Zebra BI Tables+ or Charts+ visual. Once per report.
Step Two

Comment

Anyone with SharePoint access comments directly on data points, in view mode.
STEP THREE

Act

Decisions get made where the data is. No email threads, no separate slides.

How the 45 minutes run

AGENDA
:00

Welcome

Why reporting is shifting from static consumption to decision support.
:05

Introducing Zebra BI Tables+ and Charts+

What's new, and what stays exactly the same.
:15

Live demo

Viewer commenting end to end, from the screenshot workaround to a decision made in the report.
:35

Setup and governance

Why reporting is shifting from static consumption to decision support.
:45

Q&A

Bring your reporting workflow. We'll answer live.

Presenters

Andrej Lapajne

Founder, Zebra BI
Andrej founded Zebra BI and has spent 15+ years helping finance teams transform how financial data gets structured, read, and acted on. He'll open the session and present the Zebra AI segment.

Mark Leskovšek

BI Solutions Director, Zebra BI
Mark works with clients on financial data modeling and benchmark reporting. He'll present the dataset, what it contains, where the data comes from, and why these 100 companies tell the story.

Trusted by BI leaders at top companies worldwide

55+
Expert Webinars
30K+
Professionals Trained
Free
On Demand Access
“Our financial landing page at KPN is completely based on the sales dashboard template. We don't need to invent the wheel again.”
“Zebra BI is the best feature that has been created for Power BI. It makes designing reports easy.”
“What a great audience, so much knowledge in one place. Watching Zebra BI videos was a game changer for me!”

Built for the people who build, review and sign off on reports

Who should watch this

Report builders and owners

Your reports finally get used. Reviewers act in the report instead of emailing you a screenshot to change.

Finance leaders

Your team's questions and decisions live on the report, in context. The review starts where the last one ended.

Executives

Weigh in on the number the moment you see it. No edit access, no export, no separate thread.

Heads of BI and Power BI admins

Opt-in and admin-controlled. Comments stay in your SharePoint. Your certified visuals are unchanged.
QUESTIONS

Before you register

Yes and yes. Registration is free with no seat limit, and everyone who registers gets the recording and the follow-up materials, whether or not they attend live.

No. Zebra BI Tables+ and Charts+ are two new visuals. The Zebra BI visuals you use today are unchanged and nobody has to switch. You add a Plus visual to the specific reports where you want viewer commenting.

Commenting is included in every plan, unlimited, with no per-visual caps. A viewer who comments is interacting with the report, so they need a license.

In your own Microsoft 365, in a SharePoint Excel file you choose. Zebra BI doesn't store or process comment content. Power BI workspace permissions stay as they are, and SharePoint permissions control who can comment.

No, and that's by design. Viewer commenting reads and writes a file in your own Microsoft 365, which a certified visual can't do. Certified visuals for the sealed sandbox, Plus visuals when you want collaboration and can enable SharePoint. The certified Zebra BI visuals are unchanged and stay available. [Compare certified and Plus].

Not with this. Zebra BI Tables+ and Charts+ write comments and annotations, not values back to the model.

Yes. Zebra BI Tables+ and Charts+ are built on our existing Zebra BI Tables and Charts: automatic variance calculations, IBCS charts and tables, responsive layouts, and more. The same trusted Zebra BI visuals, used by 3,000+ companies and rated 4.8 stars on Microsoft AppSource and Capterra.


Watch a viewer comment on a live Power BI report

Save my spot
Free. 45 minutes. The recording goes to everyone who registers.
See what great financial reporting looks like
Save my spot