Top 5 DAX tricks for super effective Power BI dashboards

Are you interested in knowing the tricks that can enhance the usability and user-friendliness of your dashboards in Power BI? You have come to the right place.

Simply watch the recording to learn about the top 5 DAX tricks for super effective Power BI dashboards.

Share this

Webinar Details
Don't miss this opportunity to learn about the top 5 DAX tricks in Power BI!

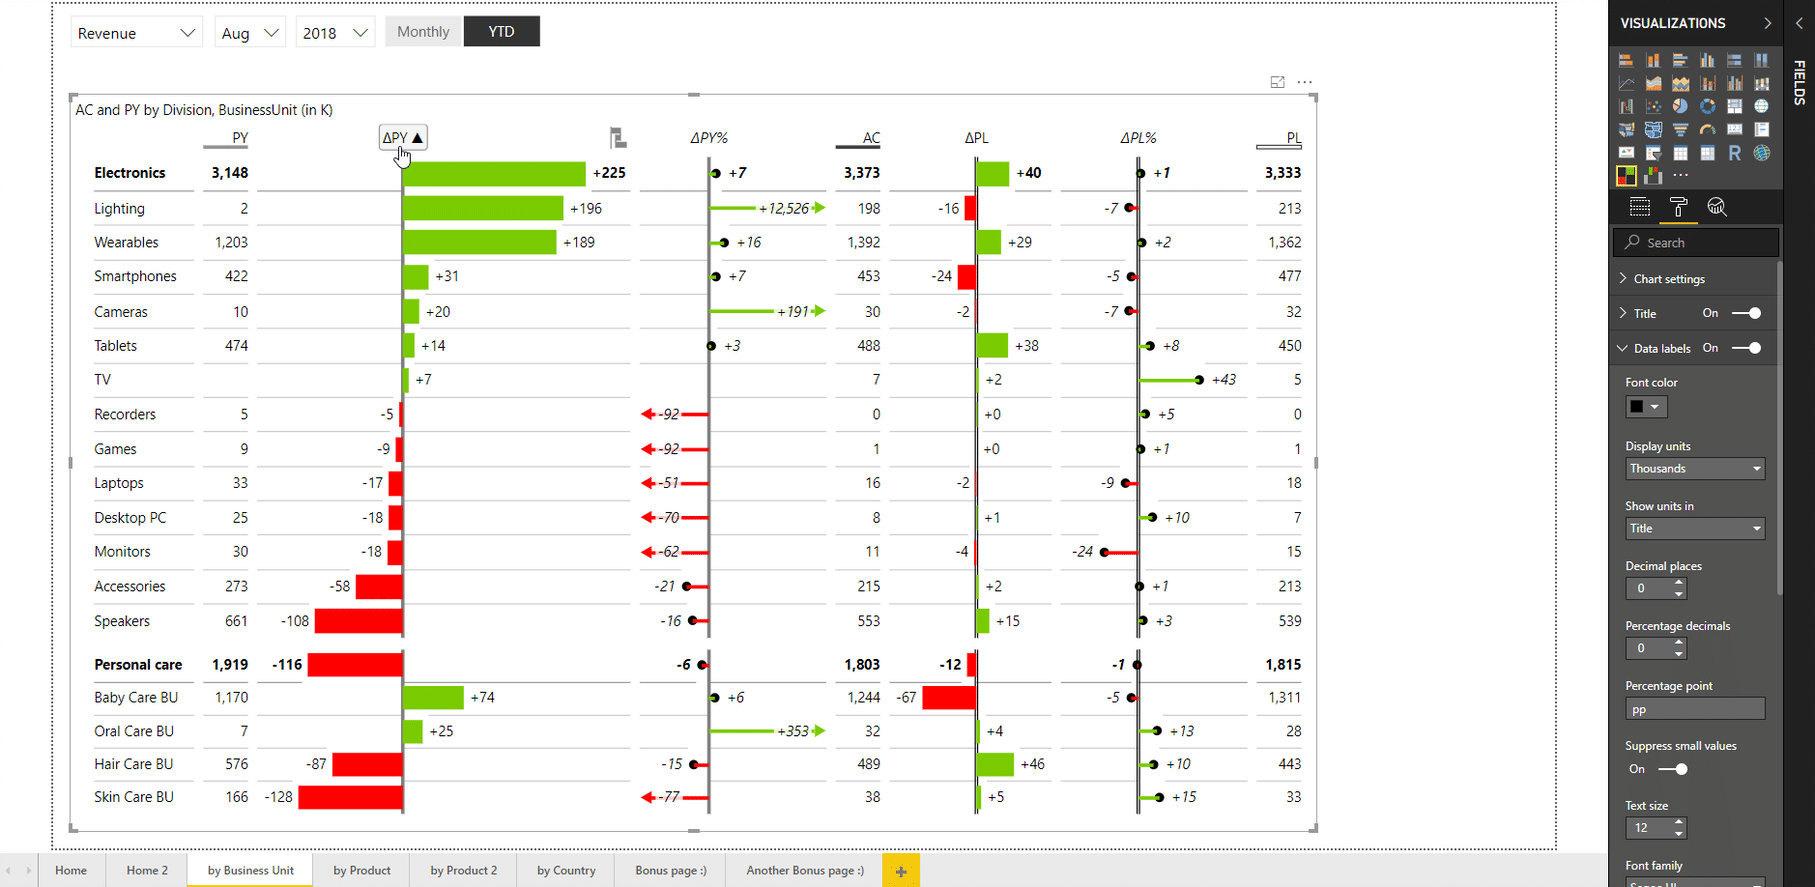
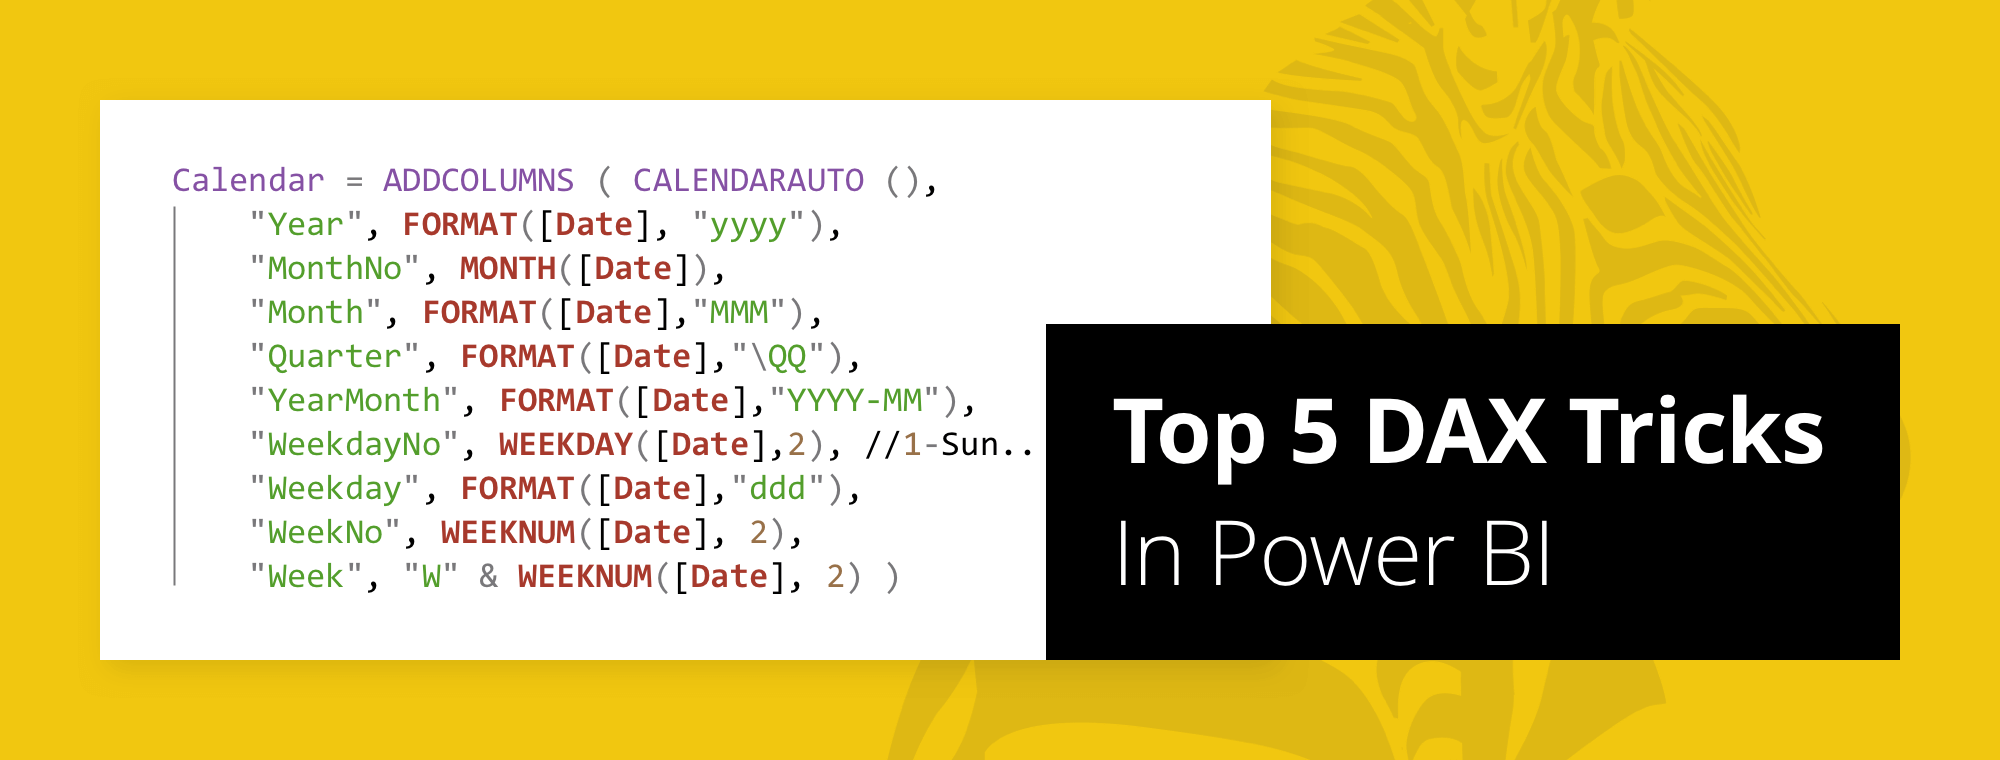
Power BI is an awesome tool and we tend to see many beautiful and colourful dashboards there. However, sometimes they tend to get too complicated and not as effective as they could be. If you need some tips on how to create calendar dimensions, adding new columns, building a dashboard and how to build the MTD/YTD switch and the KPI switch (slicer), you'll find the answers in the webinar.

Our host, Andrej Lapajne, CEO and Founder of Zebra BI, decided to share some of DAX modelling best practices and tricks with the goal to help you speed up the creation of your dashboards in reports and make them easier to maintain in the future.


You'll Learn: 

How to properly set up DAX formulas in the most practical way
Why structuring your data model upfront is so important for all your future dashboards development & maintenance
How you can shorten maintenance & development by 3 to 5 times
How to master practical formulas to calculate essential business categories: PY, Actual vs. Budget, Year to date switch (YTD), Variance

Watch on-demand

Watch the video

Presenter

Andrej Lapajne

Founder & CEO at Zebra BI
Andrej brings 25 years of experience in business intelligence and software development and 20 years as a consultant. Helping numerous international and regional companies achieve consistent and efficient internal reporting throughout the organization inspired him to build Zebra BI.

Join the conversation

What a great audience, so much knowledge in one place.
Patrick Soehlke
Managing Director at Next Vision GmbH
Watching Zebra BI videos was a game changer for me in dashboard and report design! Thank you for always having great content! ⭐️
Meena Laird
Data Analyst
Woohoo! You guys rock the data viz world - keep up the great work!
Rachel Guthrie
Customer Success at Microsoft
Our financial landing page at KPN is completely based on the sales dashboard template. We also use a copy of the consolidated financials. The templates of Zebra BI are providing us with a lot of inspiration, and we don't "need to invent the wheel" again 😉
Wilco Nagtzaam
Senior FP&A Controller
You guys are amazing! Thanks so much for the great content! Keep up the fantastic work 👍
Kimberley Canoute
Business Intelligence Analyst
An amazing visual for finance. It has a lot of possibilities such as analytic periods, variances, or custom hierarchies for your income statement. 100% advisable.
Raúl Vinuesa Arjona
Senior Data Consultant
Awesome reports. Lots of tricks inside, thanks to the Power BI and the Zebra BI visuals.
Esteban Fabiani
MS PowerBI Consultant
Zebra BI is the best feature that has been created for Power BI. It makes designing reports easy. Thank you.
Brahim Chabane
Zebra BI User
I spent a couple of hours searching for a solution, your brief tutorial was the only one that worked for me. Thanks so much!
Ryan Cheung
Zebra BI User
It looks so good to a point that makes me be like, what's the point of me learning given I'll never be that good.....😄
Cheng Wang
Zebra BI User
Amazing, Mindblowing, Supereasy
Wilco Nagtzaam
Senior FP&A Controller
I've recently been experimenting with Zebra BI's custom Table visual, which is like the native Power BI matrix on steroids. If your work allows for the use of custom visuals, I think it's definitely worth checking out. Planning on doing a video on it soon...
Brian Julius
Chief Content Officer at Enterprise DNA Ltd.
Hot damn @ZebraBI...speechless. Can’t share it but it looks good!
Jonathan Kapoor
Commercial Reporting and Insights Manager
Hey @ZebraBI: Your CEO is a cool dude and your visuals for #powerbi and #Excel are insane. Thanks @lapajne for presenting today. It was a ton of fun 👊
Lars Schreiber
Power BI Consultant & Trainer
I can't believe you always manage to pack so many new and great features into every update :-)
Pascal Kiefer
CEO & BI Consultant
I dare to say that Zebra BI is the most realy hight level custom visual that exist right now. Amazin job, great updates. I definitely will keep recomending this custom visual to our clients.
Harry Ferrera
Senior Business Intelligence (BI) Analyst
I had a phone interview for a #PowerBI contract, where the interviewer said of the sample dashboards in my CV: "Great...I see you use @ZebraBI!" How cool is that? And they mentioned my top-secret passphrase on the call: "Actionable Insight". I'm in.
Jeff "Power BI Lobbyist" Weir
Modelling/Visualisation consultant and analytical storyteller
The reusable trick of switch I think is brilliant! And obviously, Zebra BI table replaces any other table now in Power bi. RIP to normal tables!
Manuel Barahona Gandía
Business Intelligence Reporting Manager
This visual from Zebra BI enables you to build stunning P&L, CF, and BS statements with complex structures with ease. Very intuitive for developers and users. In my opinion the best solution for Financial Reporting structures. 11 Stars!
Daniel DeHaven
Director of Financial Systems
Already tried stacked bar. It's fantastic! Thank you for such a great feature!
Tania Tombak
Principal Consultant, Executive Dashboards and Data Analysis
As you say, Andrej Lapajne, we spent A LOT, searching and explaining how to do Comments, with Power Apps, and also with the help of Excel. They were workarounds!!! No doubt...this is awesome and the simple way to go forward.
Esteban Fabiani
MS PowerBI Consultant