How to convert boring reports into an actionable data story

Tired of messy spreadsheets with bad visualizations?

It's time to make them a thing of the past. With Zebra BI for Office, you can now present the most important insights fast, saving yourself a ton of time and money.

Whether you're a business analyst, finance pro, BI ninja, occasional report creator or just a reporting enthusiast, this webinar can help you:

  • boost your Excel & PowerPoint reports with the new Zebra BI for Office
  • discover the latest reporting best practices
  • apply the newly acquired knowledge to your end-of-year reports – and impress everyone with your incredible skills!
Share this

Webinar Details
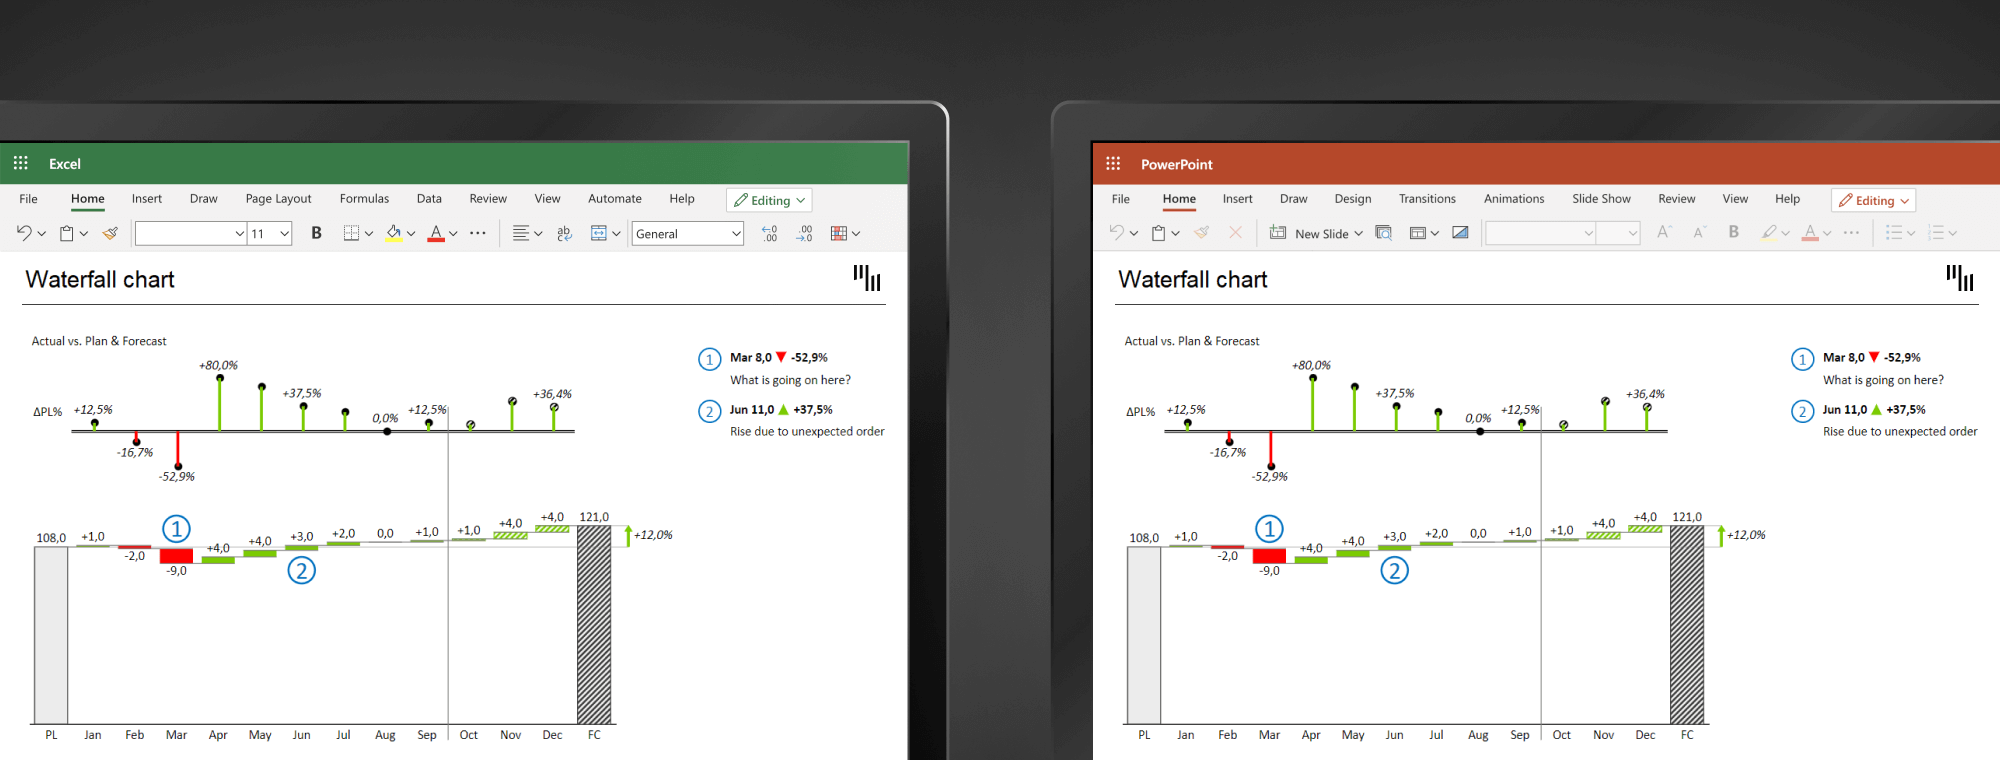
Tips & tricks for actionable reporting in Excel & PowerPoint

No more time spent on hacking #Excel to make the charts look good. Now with one click & boom! voilà! ⚡⚡ THANK YOU for developing this for the huge community of Excel users! - Carlos Barboza, Guerilla Data Analyst

Excel is still the #1 BI tool used for business reporting. A controversial statement, one would say.  

But the reality is that Excel is everywhere. Flexibility, ease of use, and low entry barriers are just some of the benefits that are making Excel a ‘here-to-stay' tool.  

However, for the most part, reports in spreadsheets or slides still don’t follow modern reporting best practices. This is not just a design problem, but it can actually cost you a lot of money if people don’t get the right business insights in seconds. This means you’re wasting their time (and, well, money).  

Staying agile in uncertain times is crucial. Having a single source of truth across your entire stack (Power BI, Excel, and/or PowerPoint) can save hours of work and advanced visualizations with additional context give you an immediate understanding of the performance.  

This is what you’ll get by using Zebra BI for Office. With only one click you can unlock business insights instantly and deliver just the right information to everyone. The best part? You can do that either in Excel, PowerPoint, or Power BI. Transform your reporting and stay on top of your performance at all times. 

You'll Learn: 

How to create small multiples from a simple pivot table in Excel
How to easily create advanced P&L, variance analysis, cash flow analysis, and more!
How to add additional context to your data using automatically calculated variances & dynamic comments
How to combine Power BI, Excel & PowerPoint to get the most out of your data.

Watch on-demand

Watch the video

Presenter

Andrej Lapajne

Founder & CEO at Zebra BI
Andrej brings 25 years of experience in business intelligence and software development and 20 years as a consultant. Helping numerous international and regional companies achieve consistent and efficient internal reporting throughout the organization inspired him to build Zebra BI.

Join the conversation

What a great audience, so much knowledge in one place.
Patrick Soehlke
Managing Director at Next Vision GmbH
Watching Zebra BI videos was a game changer for me in dashboard and report design! Thank you for always having great content! ⭐️
Meena Laird
Data Analyst
Woohoo! You guys rock the data viz world - keep up the great work!
Rachel Guthrie
Customer Success at Microsoft
Our financial landing page at KPN is completely based on the sales dashboard template. We also use a copy of the consolidated financials. The templates of Zebra BI are providing us with a lot of inspiration, and we don't "need to invent the wheel" again 😉
Wilco Nagtzaam
Senior FP&A Controller
You guys are amazing! Thanks so much for the great content! Keep up the fantastic work 👍
Kimberley Canoute
Business Intelligence Analyst
An amazing visual for finance. It has a lot of possibilities such as analytic periods, variances, or custom hierarchies for your income statement. 100% advisable.
Raúl Vinuesa Arjona
Senior Data Consultant
Awesome reports. Lots of tricks inside, thanks to the Power BI and the Zebra BI visuals.
Esteban Fabiani
MS PowerBI Consultant
Zebra BI is the best feature that has been created for Power BI. It makes designing reports easy. Thank you.
Brahim Chabane
Zebra BI User
I spent a couple of hours searching for a solution, your brief tutorial was the only one that worked for me. Thanks so much!
Ryan Cheung
Zebra BI User
It looks so good to a point that makes me be like, what's the point of me learning given I'll never be that good.....😄
Cheng Wang
Zebra BI User
Amazing, Mindblowing, Supereasy
Wilco Nagtzaam
Senior FP&A Controller
I've recently been experimenting with Zebra BI's custom Table visual, which is like the native Power BI matrix on steroids. If your work allows for the use of custom visuals, I think it's definitely worth checking out. Planning on doing a video on it soon...
Brian Julius
Chief Content Officer at Enterprise DNA Ltd.
Hot damn @ZebraBI...speechless. Can’t share it but it looks good!
Jonathan Kapoor
Commercial Reporting and Insights Manager
Hey @ZebraBI: Your CEO is a cool dude and your visuals for #powerbi and #Excel are insane. Thanks @lapajne for presenting today. It was a ton of fun 👊
Lars Schreiber
Power BI Consultant & Trainer
I can't believe you always manage to pack so many new and great features into every update :-)
Pascal Kiefer
CEO & BI Consultant
I dare to say that Zebra BI is the most realy hight level custom visual that exist right now. Amazin job, great updates. I definitely will keep recomending this custom visual to our clients.
Harry Ferrera
Senior Business Intelligence (BI) Analyst
I had a phone interview for a #PowerBI contract, where the interviewer said of the sample dashboards in my CV: "Great...I see you use @ZebraBI!" How cool is that? And they mentioned my top-secret passphrase on the call: "Actionable Insight". I'm in.
Jeff "Power BI Lobbyist" Weir
Modelling/Visualisation consultant and analytical storyteller
The reusable trick of switch I think is brilliant! And obviously, Zebra BI table replaces any other table now in Power bi. RIP to normal tables!
Manuel Barahona Gandía
Business Intelligence Reporting Manager
This visual from Zebra BI enables you to build stunning P&L, CF, and BS statements with complex structures with ease. Very intuitive for developers and users. In my opinion the best solution for Financial Reporting structures. 11 Stars!
Daniel DeHaven
Director of Financial Systems
Already tried stacked bar. It's fantastic! Thank you for such a great feature!
Tania Tombak
Principal Consultant, Executive Dashboards and Data Analysis
As you say, Andrej Lapajne, we spent A LOT, searching and explaining how to do Comments, with Power Apps, and also with the help of Excel. They were workarounds!!! No doubt...this is awesome and the simple way to go forward.
Esteban Fabiani
MS PowerBI Consultant