Charting in Excel doesn’t have to be a nightmare anymore. Let Zebra BI automatically turn numbers into instant insights with advanced charts & tables. Right in your Excel.
Simply slide between waterfall, variance, column, area, line, dot, lollipop, and ‘hills&valleys’ charts, or even create small multiples from your pivot table!
AUTOMATIC VARIANCE CALCULATIONS
Display variances out-of-the-box
Showing numbers within a context is key to understanding business performance. Don't just show your sales numbers, show them compared to your plan or the previous year!
The best part? Zebra BI's utterly flexible and intuitive business charts and tables automatically calculate absolute and relative variances for you!
DYNAMIC COMMENTING
Integrate comments for better storytelling
Your managers are busy. Make sure you show them just the information they need to make the right decisions.
Zebra BI for Excel helps you deliver actionable insights with integrated dynamic comments. Make any changes to your data and they will update accordingly to ensure your reports are always up to speed.
“No more time spent on hacking #Excel to make the charts look good.”
Zebra BI for Excel makes it easy to create even the most advanced reports with multiple charts within one visual.
Use a complex pivot table and turn it into a small multiples chart with one click. By creating advanced visual analyses, you will produce interactive Excel dashboards and impress everyone around you.
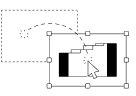
FULLY RESPONSIVE VISUALISATIONS
Adapt information density with responsive layout
Zebra BI visuals for ExceI are the world's first fully responsive visualizations. The visuals will automatically adapt the amount of information presented to fit the available space.
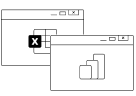
COLLABORATE EFFECTIVELY
Work on your desktop or collaborate online
Having a single source of truth is a prerequisite for faster and easier data consolidation.
Sharing spreadsheets with different people and teams over time creates different local versions which can make them difficult to follow (think "final-FINAL-FINAL" file names).
Create reports in Excel desktop and share them with your team online to ensure more efficient collaboration where everybody is looking at the same version of data.
“What a great way to tell your data - I love you.”
“No more time spent on hacking #Excel to make the charts look good. Now with one click & boom! voilà! THANK YOU for developing this for the huge community of Excel users!“
Carlos Barboza
Guerilla Data Analyst
“Truly an amazing job which will change the way controller’s and financial analysts can do their work and focus on the actionable massages and not on the visualization! That part has been taken care of! Nice job & thanks.”
Casper Plantinga
Customer Success Director
“I had the privilege to do a test drive, and yes this product deserves multiple ❤ ❤ ❤“
Wilco Nagtzaam
Senior FP&A Controller @ KPN
Awesome reports. Lots of tricks inside, thanks to the Power BI and the Zebra BI visuals.
Esteban Fabiani
MS PowerBI Consultant
Why Zebra BI
Report consistency
Quick comprehension of numbers by using the right charts and colors, following IBCS standards for consistent reports.
Data security
We don't store your data. All we do is use it to render visuals in your Excel. We're GDPR and CCPA-compliant.
Not another tool = BI consolidation
With Zebra BI you get advanced reporting and visualizations in Excel, complementing your existing BI tools.
Ready to see Zebra BI for Office in action?
Insert Zebra BI into your Excel and see the magic in your data! You can also contact us to help you build your first test report and create a custom package for your business.