“What a great way to tell your data - I love you.”
“So amazing, even Microsoft uses it for internal reporting.”
“No more Excel hacking for chart aesthetics!”
“It made my work so much easier.”
“My reports look more professional and polished.”
“Intuitive and easy to use - Zebra BI is a game-changer.”
Create advanced charts and tables in 1 click
Let Zebra BI automatically turn numbers into instant insights with advanced charts & tables.
Right in your Excel.
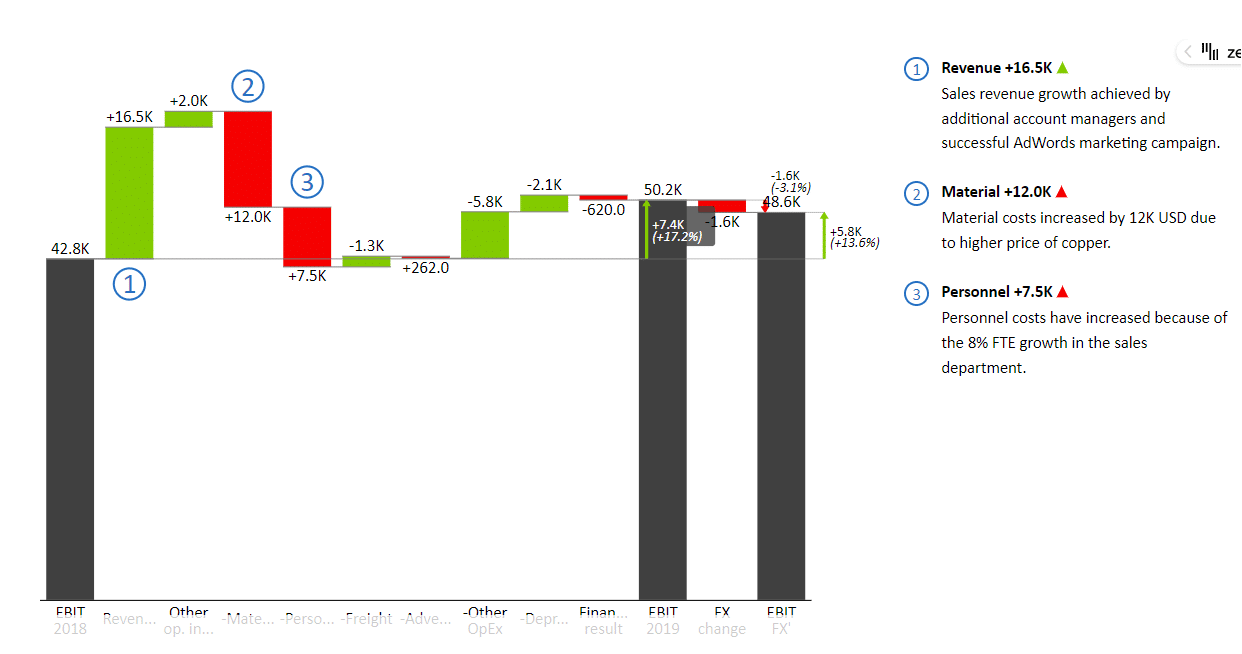
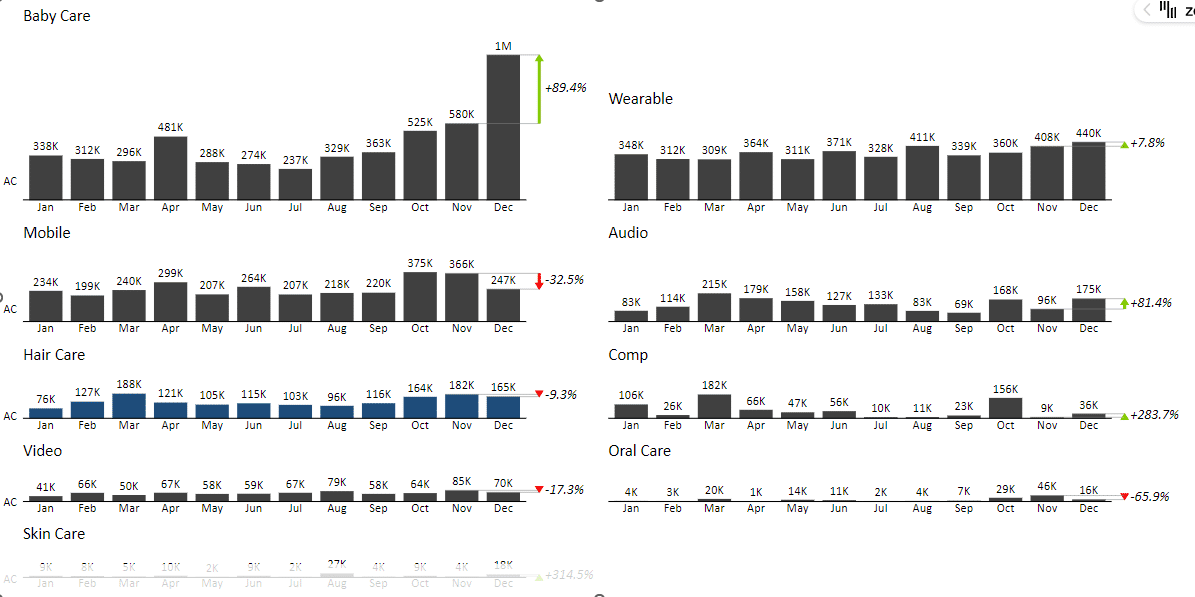
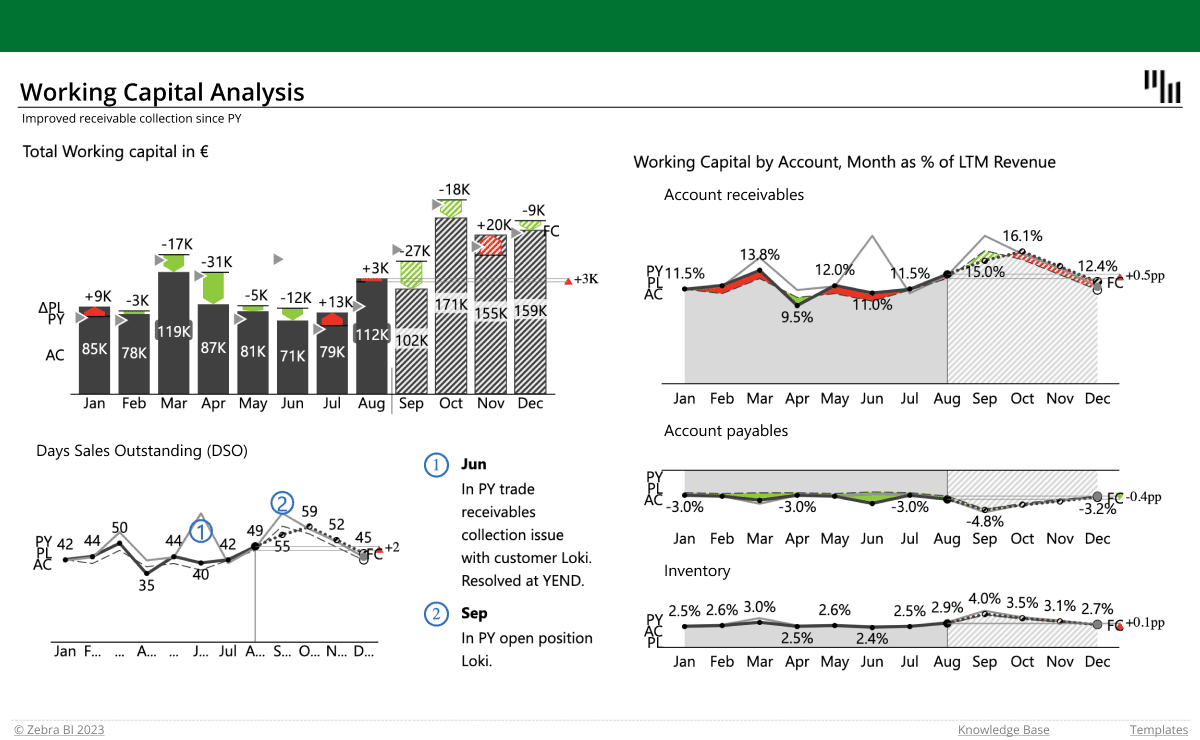
Simply slide between waterfall, variance, column, area, line, dot, lollipop, and ‘hills&valleys’ charts...
or even create small multiples from your pivot table!
Right in your Excel.
Simply slide between waterfall, variance, column, area, line, dot, lollipop, and ‘hills&valleys’ charts...
or even create small multiples from your pivot table!
Display variances out-of-the-box
Showing numbers within a context is key to understanding business performance.
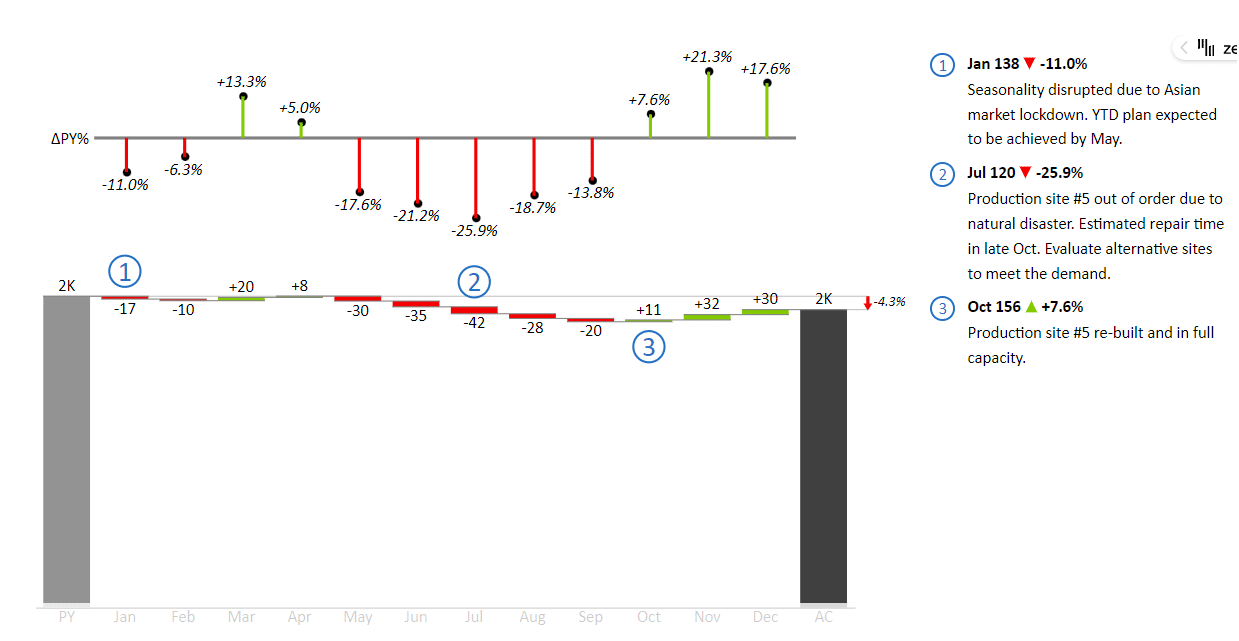
Don't just show your sales numbers, show them compared to your plan or the previous year!
The best part?
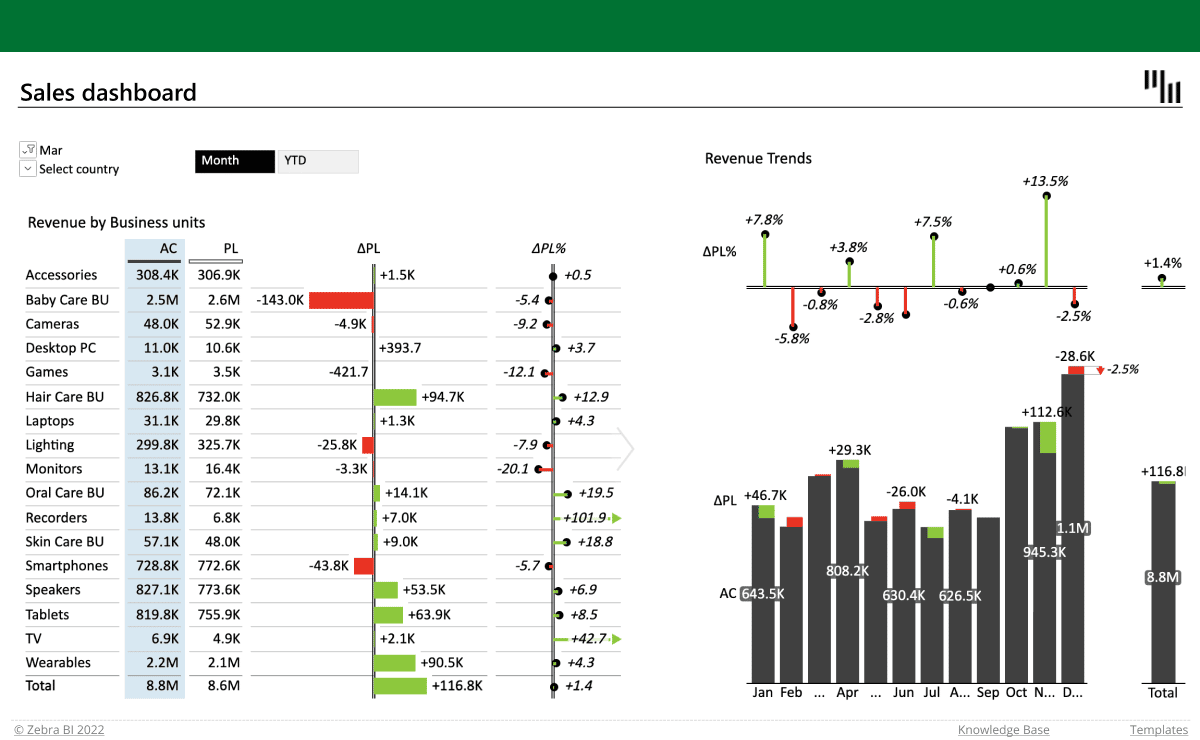
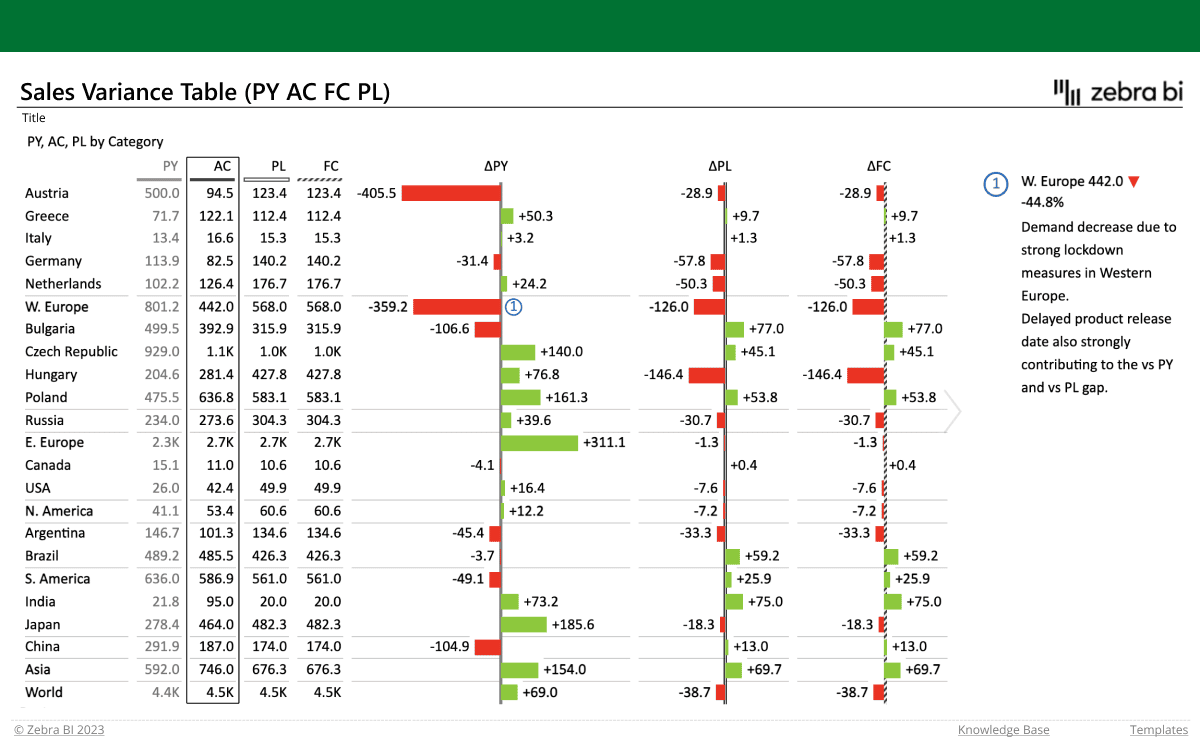
Zebra BI's utterly flexible and intuitive business charts and tables automatically calculate absolute and relative variances for you!
Don't just show your sales numbers, show them compared to your plan or the previous year!
The best part?
Zebra BI's utterly flexible and intuitive business charts and tables automatically calculate absolute and relative variances for you!
Integrate comments for better storytelling
Your managers are busy.
Make sure you show them just the information they need to make the right decisions.
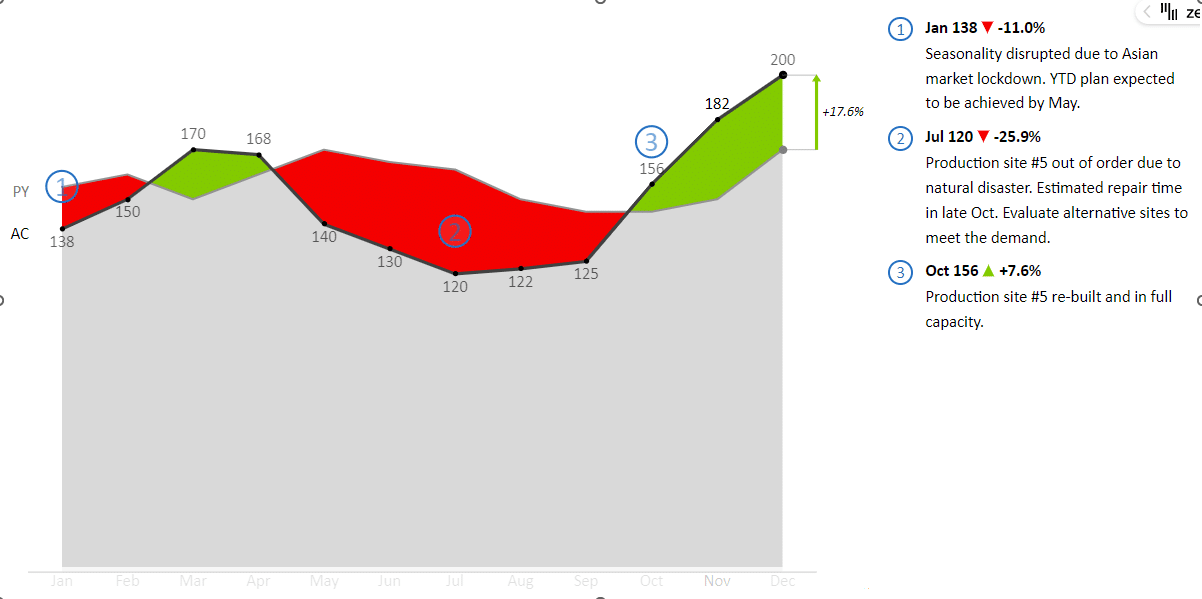
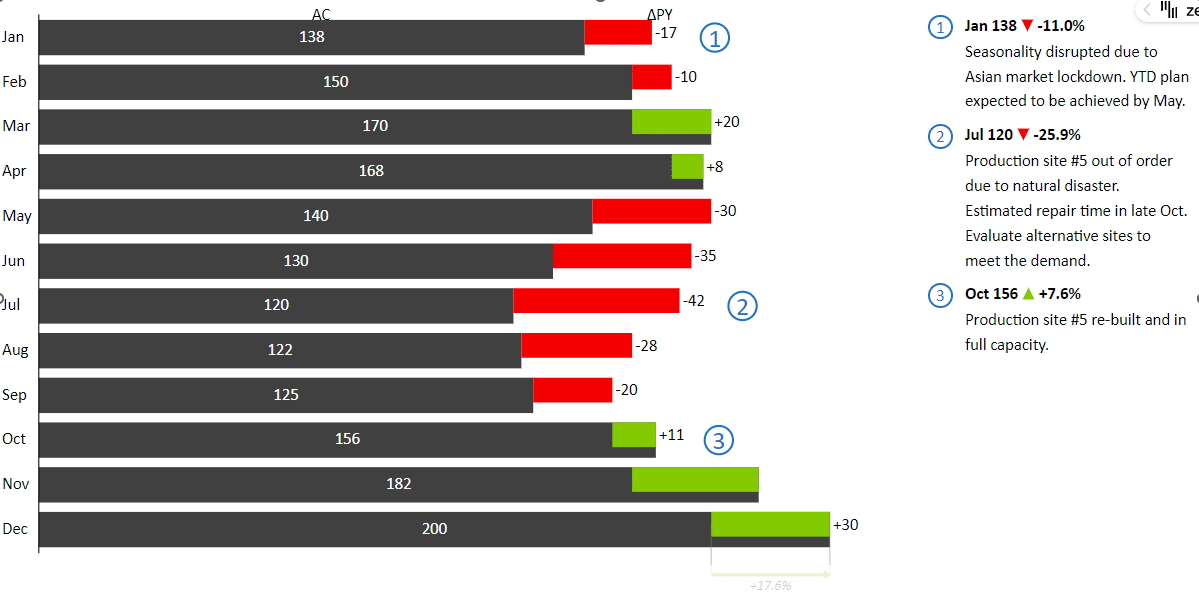
Zebra BI for Excel helps you deliver actionable insights with integrated dynamic comments.
Make any changes to your data and they will update accordingly to ensure your reports are always up to speed.
Make sure you show them just the information they need to make the right decisions.
Zebra BI for Excel helps you deliver actionable insights with integrated dynamic comments.
Make any changes to your data and they will update accordingly to ensure your reports are always up to speed.
Create even the most advanced reports
Zebra BI for Excel makes it easy to create even the most advanced reports with multiple charts within one visual.
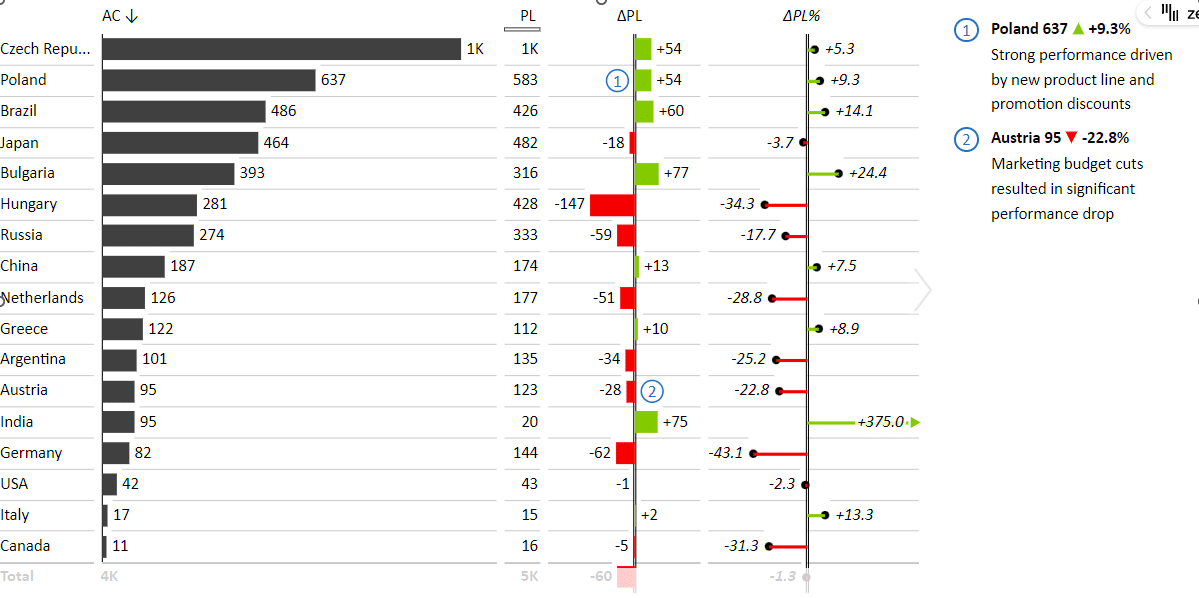
Use a complex pivot table and turn it into a small multiples chart with one click.
By creating advanced visual analyses, you will produce interactive Excel dashboards and impress everyone around you.
Use a complex pivot table and turn it into a small multiples chart with one click.
By creating advanced visual analyses, you will produce interactive Excel dashboards and impress everyone around you.
Adapt information density with a responsive layout
Zebra BI visuals for ExceI are the world's first fully responsive visualizations.
The visuals will automatically adapt the amount of information presented to fit the available space.
The visuals will automatically adapt the amount of information presented to fit the available space.
Work on your desktop or collaborate online
Having a single source of truth is a prerequisite for faster and easier data consolidation.
Sharing spreadsheets with different people and teams over time creates different local versions which can make them difficult to follow...
Think "final-FINAL-FINAL" file names. 😊
Create reports in Excel desktop and share them with your team online to ensure more efficient collaboration where everybody is looking at the same version of data.
Create stunning financial statements
Say goodbye to spreadsheets where key business insights get buried under a large amount of data.
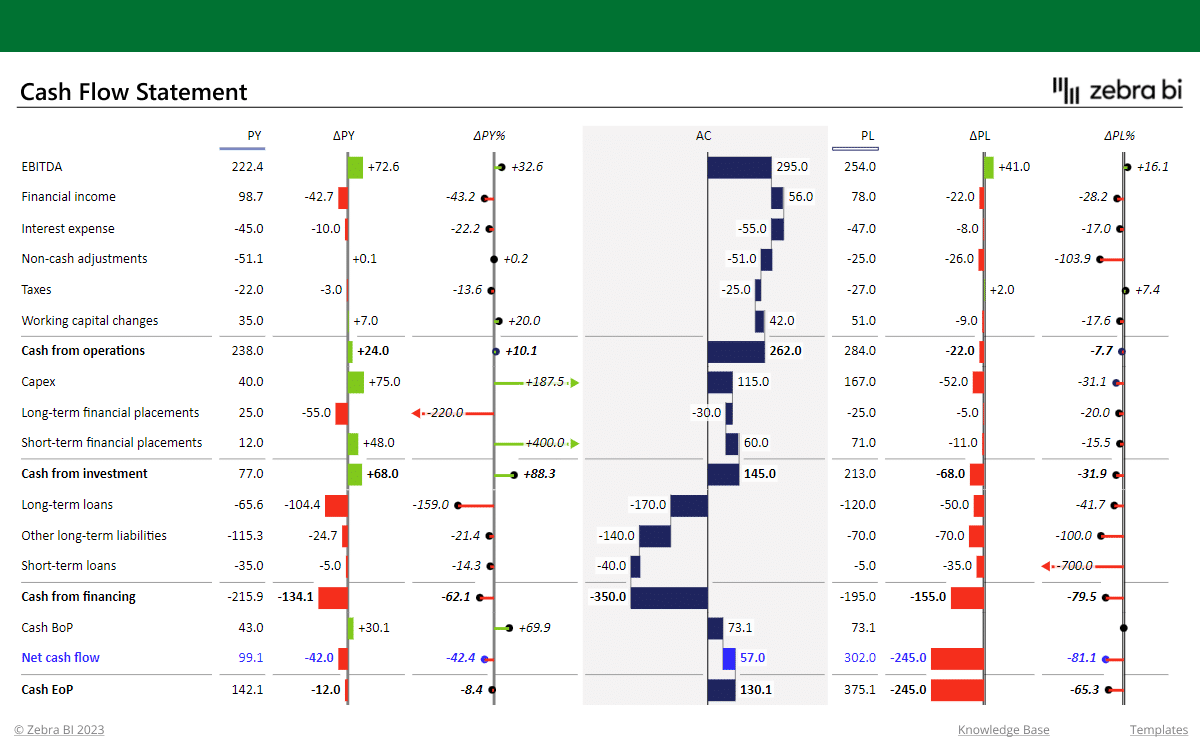
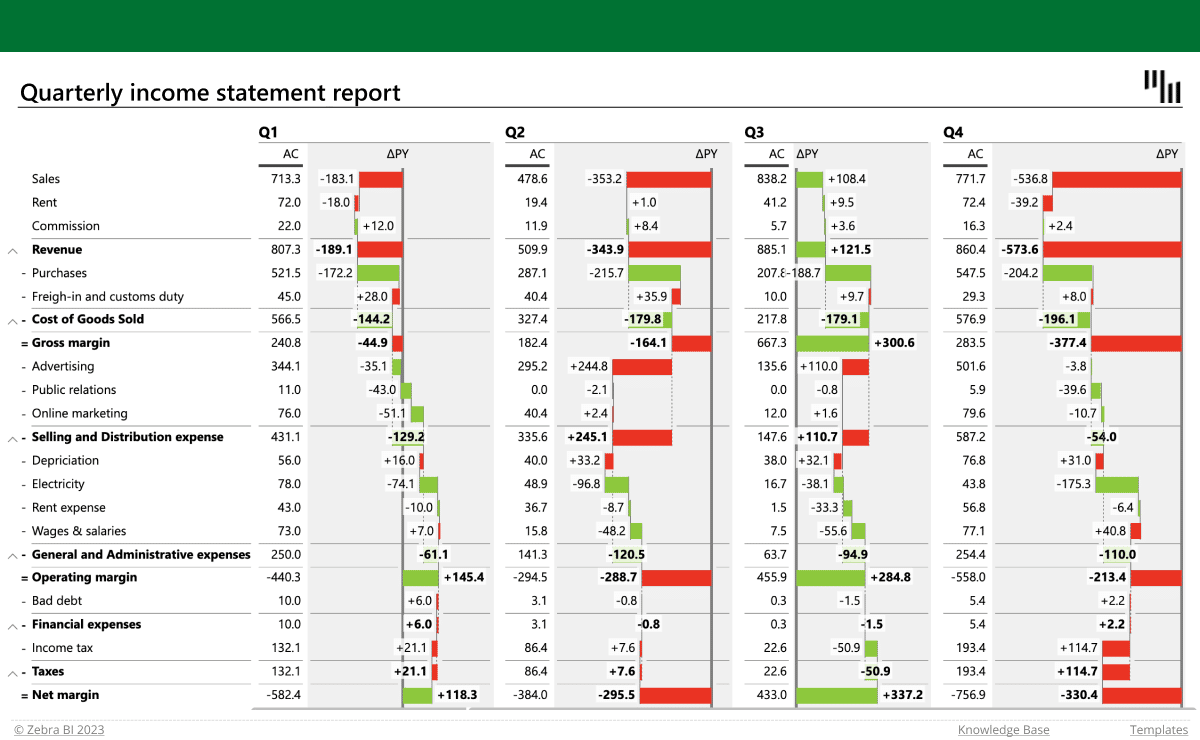
With Zebra BI you can create user-friendly income statements, variance analyses, and price-volume-mix variance analyses in Excel!
With subtotals, invert functions for costs, reorderable columns, automatic variance charts, and much more...
With Zebra BI you can create user-friendly income statements, variance analyses, and price-volume-mix variance analyses in Excel!
With subtotals, invert functions for costs, reorderable columns, automatic variance charts, and much more...
Trusted by the world's leading professionals
1,500,000+
data professionals leverage Zebra BI product and resources
3,000+
clients rely on our services and
trust us with their businesses
trust us with their businesses
118
Countries from across the world use Zebra BI
*Over 1 million Zebra BI users trust us worldwide. View customer by industry
More than 40 customizable bussiness report templates
carefully designed to cover every detail of your report.
Long-term Assets and CapEx Report
Cash Flow Statement form Pivot Table
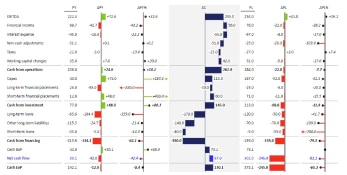
Break-Even Analysis Template for Excel
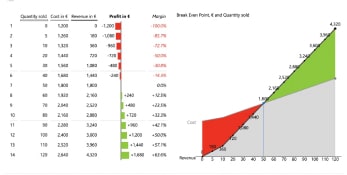
Working Capital Analysis
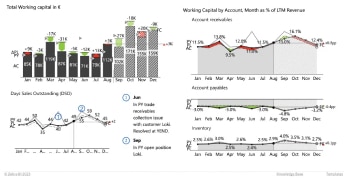
Consolidated financials dashboard in Excel
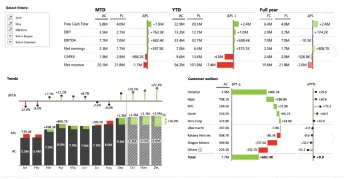
Sales variance report with multiple levels
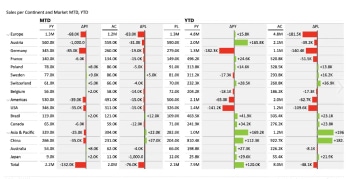
Sales overview report in Excel
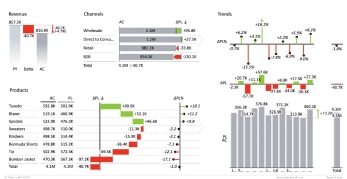
Sales Dashboard
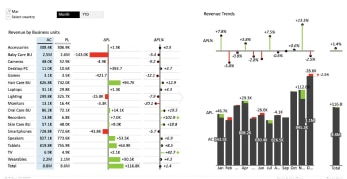
Revenue-cost-profit analysis
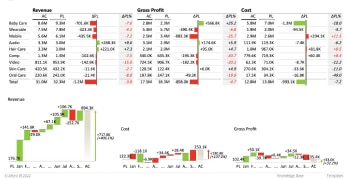
Inventory report

Quarterly income statement

Income statement with multiple levels

Hear it from established data experts
“This tool is unique. Most tools only show us WHAT happened. Zebra BI answers WHY it happened.”

Gabriel Medina
Analyst at GxSoft Argentina
“Our controllers now spend less time preparing comprehensive reports and more time analyzing data and crystallizing the message.”

Alejandro Meyer
Planning & Controlling Director at SanLucar Fruit
“This a highly professional product. Our company’s leadership (finance and operations) is already asking we roll this out to all our PBI financial reports.”

Joe Pawlowski
Innovation Manager - Business Intelligence, DHL

Report consistency
quick comprehension of numbers by using the right charts and colors, following IBCS standards for consistent reports.

Data security
We don't store your data. All we do is use it to render visuals in your Excel. We're GDPR and CCPA-compliant.

Not another tool =
BI consolidation
With Zebra BI you get advanced reporting and visualizations in Excel, complementing your existing BI tools and leveraging the power of millions of Excel users.
Make your reports stand out
Insert Zebra BI into your Excel and see the magic in your data happen!
Try Zebra BI for free

Wait! Don’t leave yet!
Don’t settle for ordinary and boring. Join over 1.5 million Zebra BI users who produce insightful reports every time. Now for free!
Try it for free