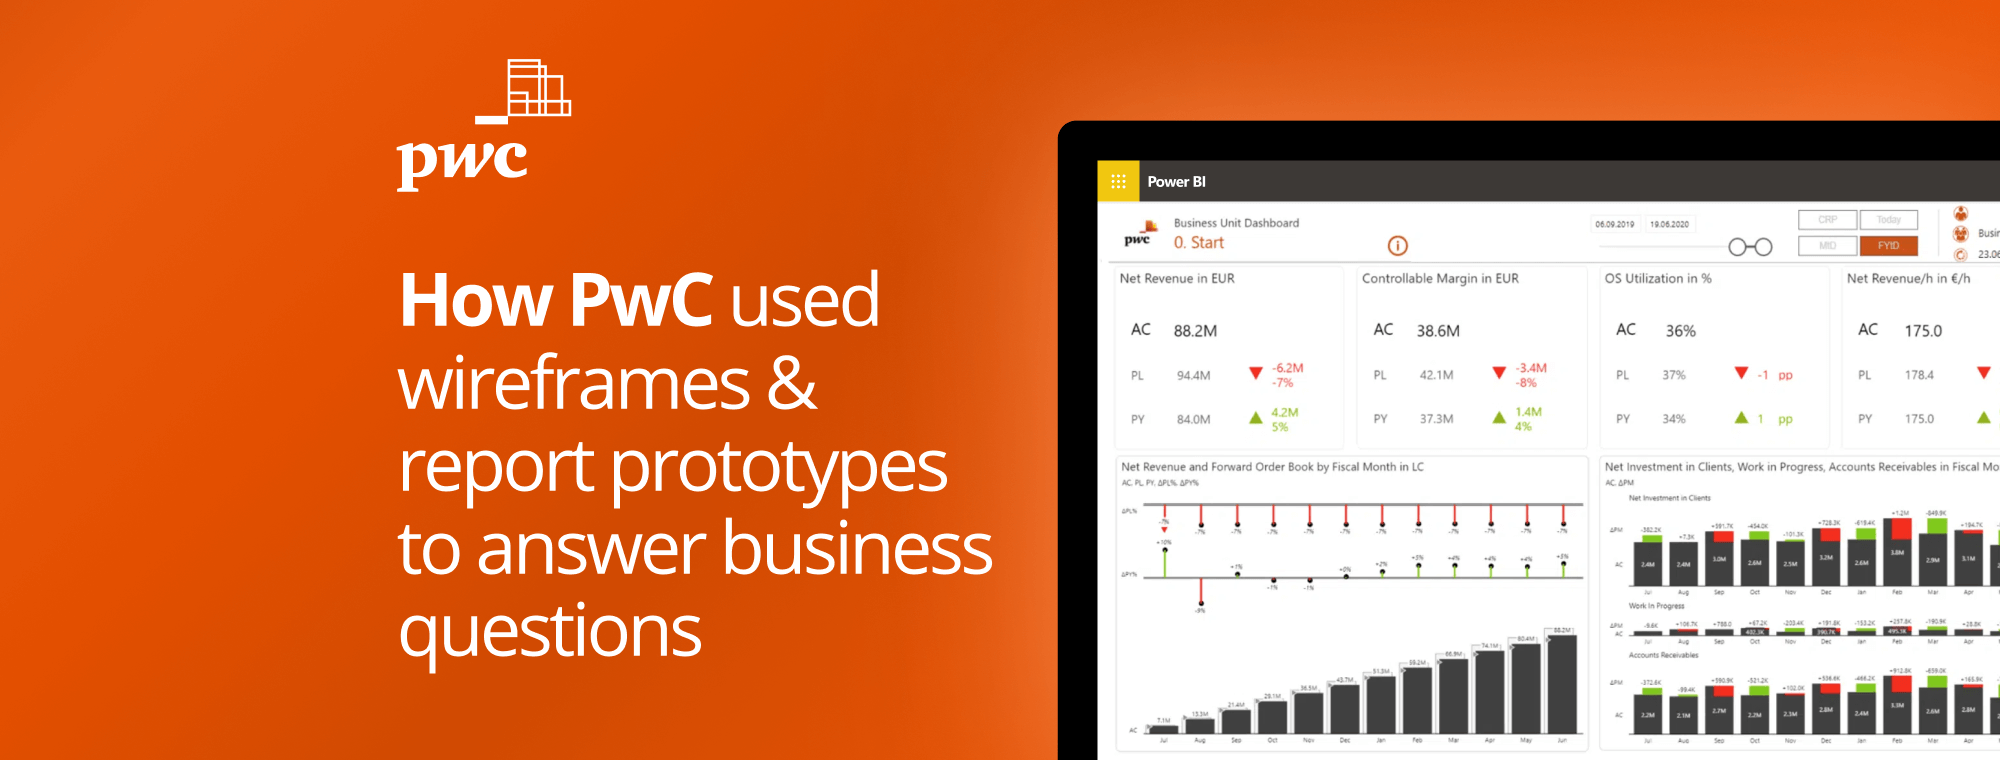
Let Zebra BI visuals do the heavy lifting. Automatically calculate and display your key business drivers, so you can focus on strategy, not crunching numbers.
Show the story behind the numbers
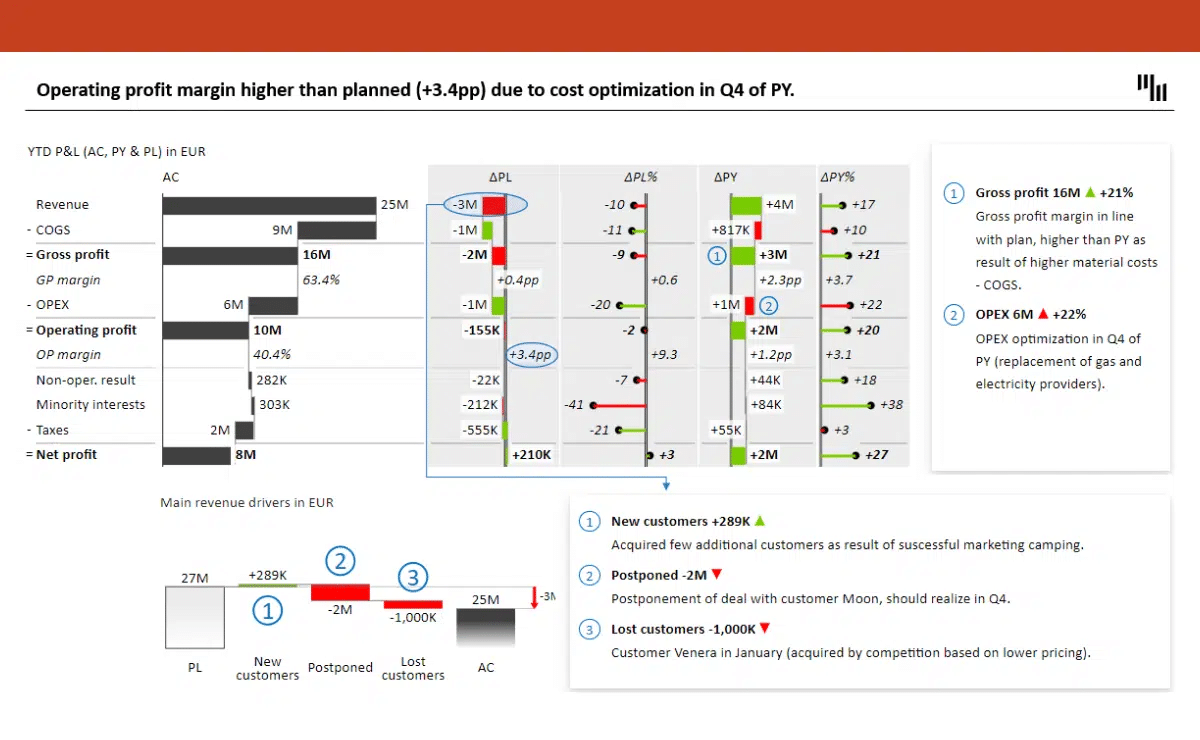
Use dynamic comments, focus mode, and drill-through features reveal the context behind your data. Enable yourself and your team to make informed decisions faster.
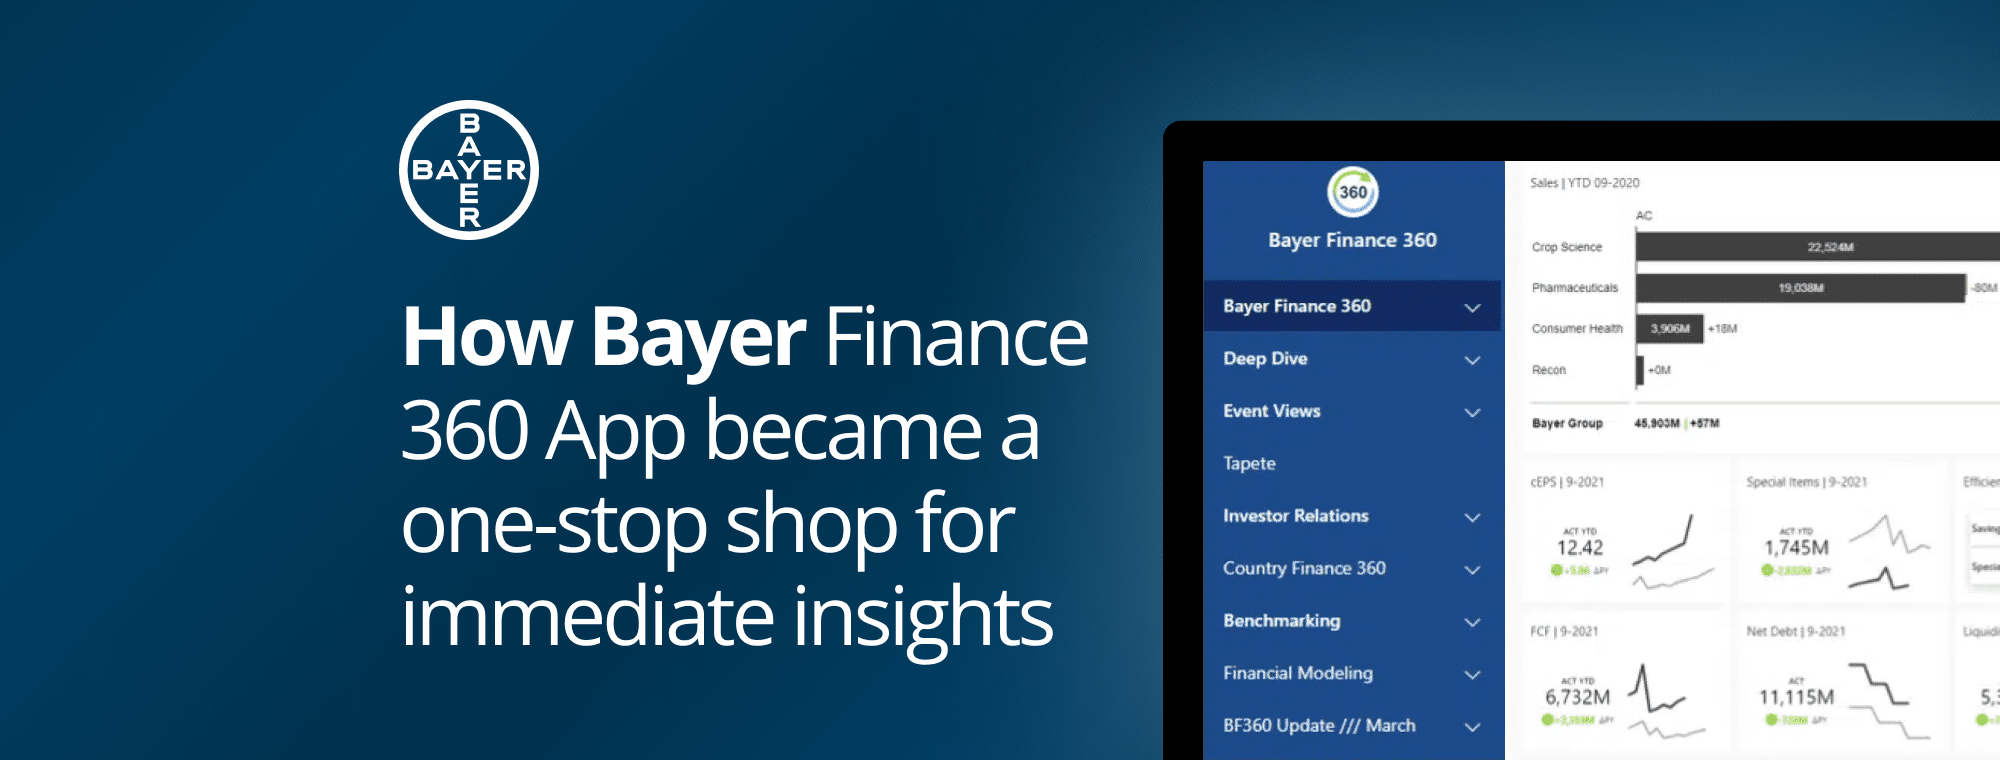
Keep reports consistent across teams
Zebra BI’s IBCS-compliant visuals and custom themes ensure every report follows the same logic, reducing errors and improving understanding across teams.
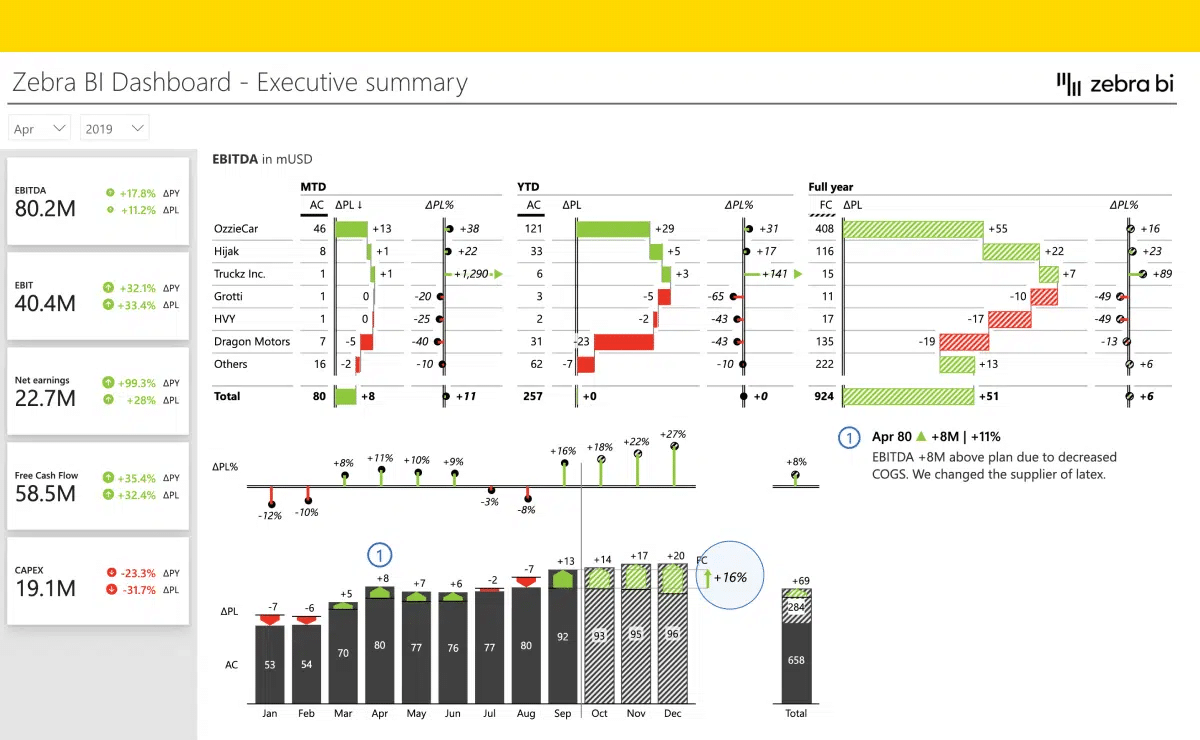
Paint a complete picture of your business
Combine all three Zebra BI visuals in Power BI to uncover the full story behind your company’s results, from top-line trends to granular details.
So amazing, even Microsoft uses it for internal reporting.
MORE THAN 1,500,000 EXPERTS USE OUR PRODUCTS DAILY
Here is what they think
Verified customer
“This tool is unique. Most tools only show us WHAT happened. Zebra BI answers WHY it happened.”
Gabriel Medina
Analyst at GxSoft Argentina
Verified customer
“Our controllers now spend less time preparing comprehensive reports and more time analyzing data and crystallizing the message.”
Alejandro Meyer
Planning & Controlling Director at SanLucar Fruit
Verified customer
“This a highly professional product. Our company’s leadership (finance and operations) is already asking we roll this out to all our PBI financial reports.”
Joe Pawlowski
Innovation Manager - Business Intelligence, DHL
START FOR FREE
Ready to start uncovering actionable insights from your data?
Explore Zebra BI for Office and Power BI for free, test our tools on your data, and see the magic happen! You can also contact us to help you build your first test report and create a custom packages for your business.
 September 8th
 February 22nd