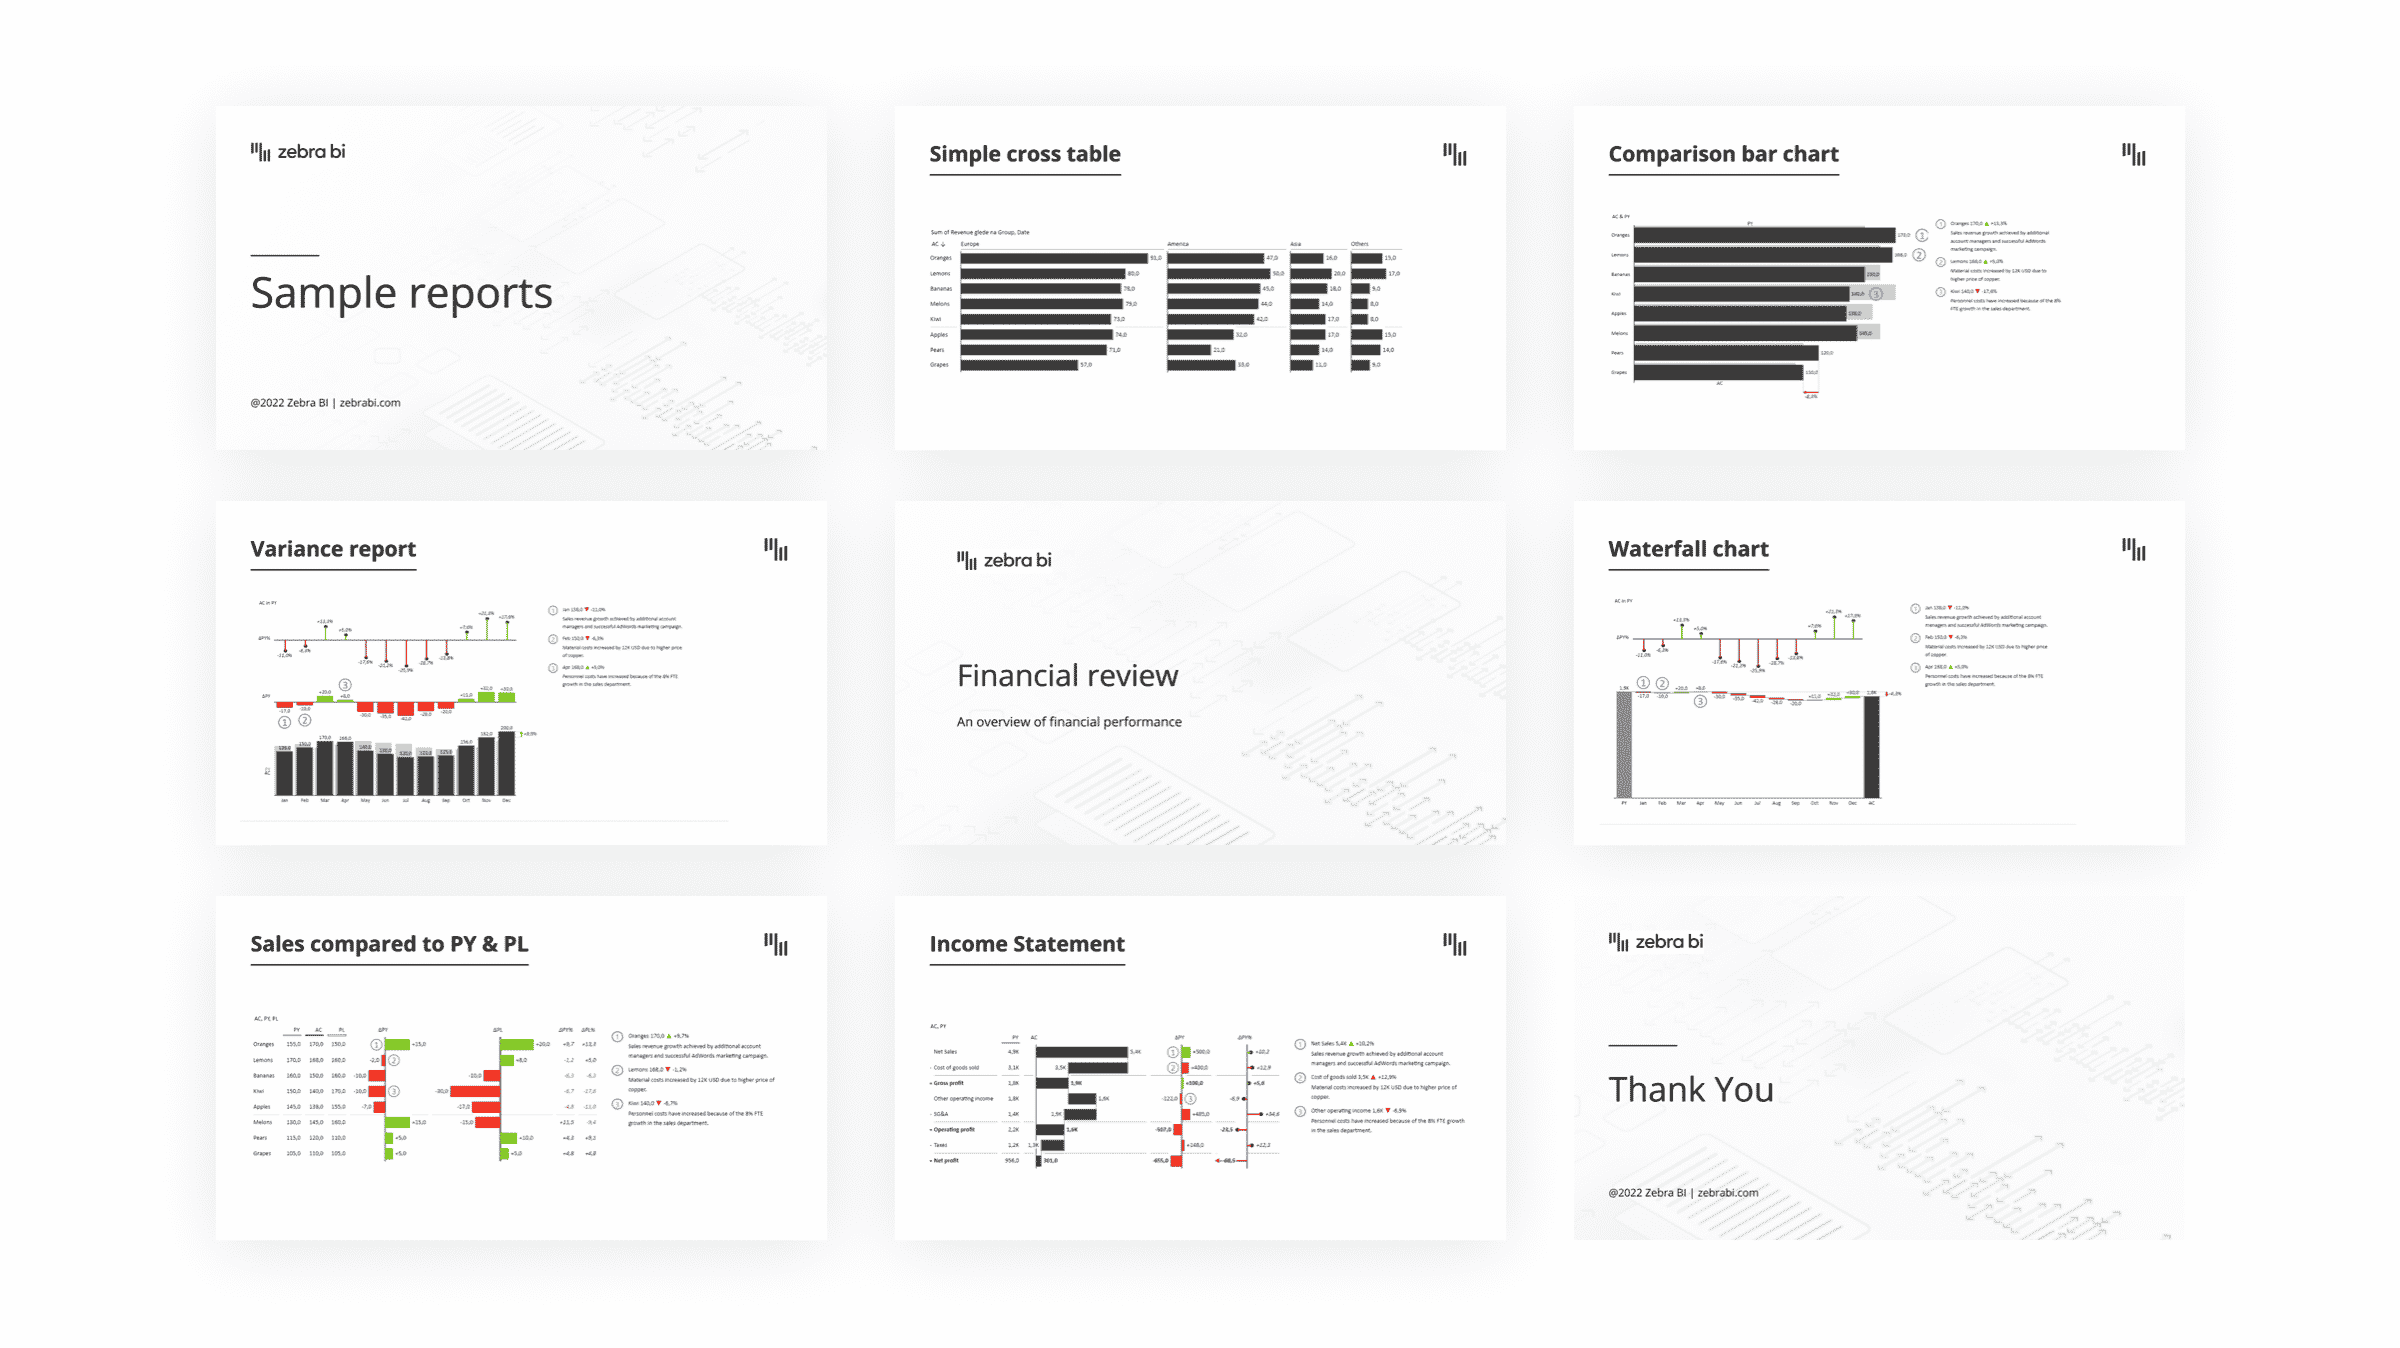
Use 30+ advanced charts & tables
Let Zebra BI automatically turn numbers into instant insights with advanced charts & tables.
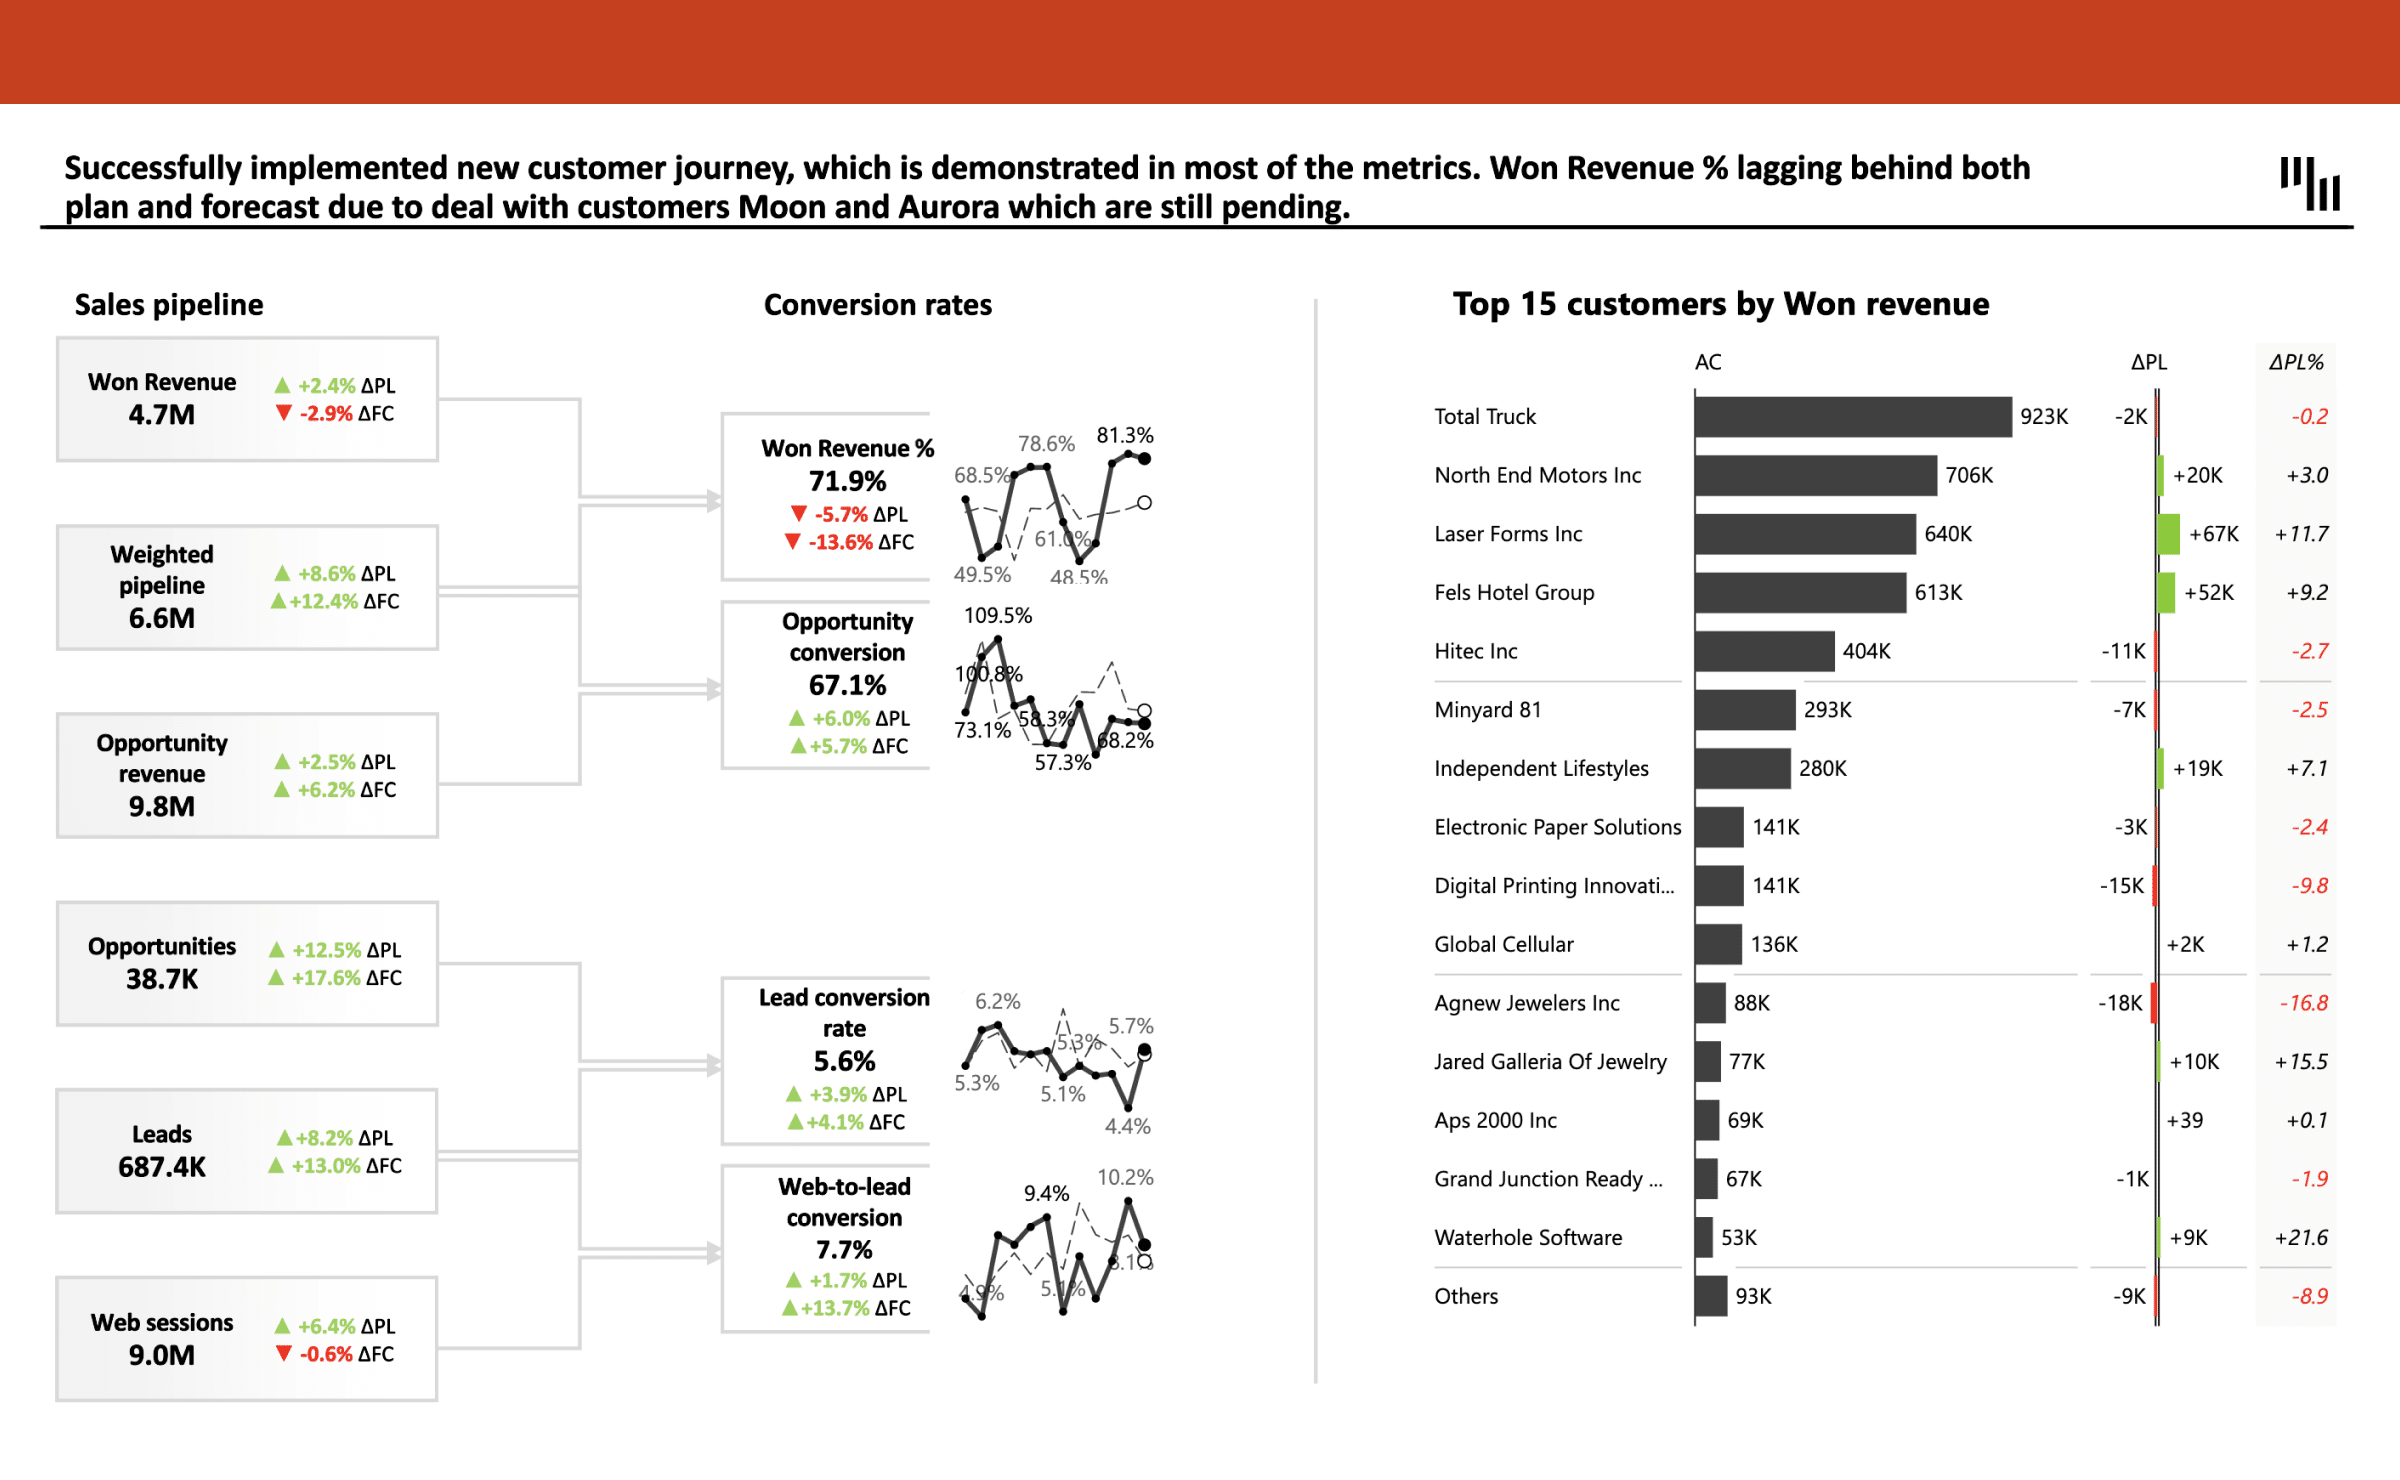
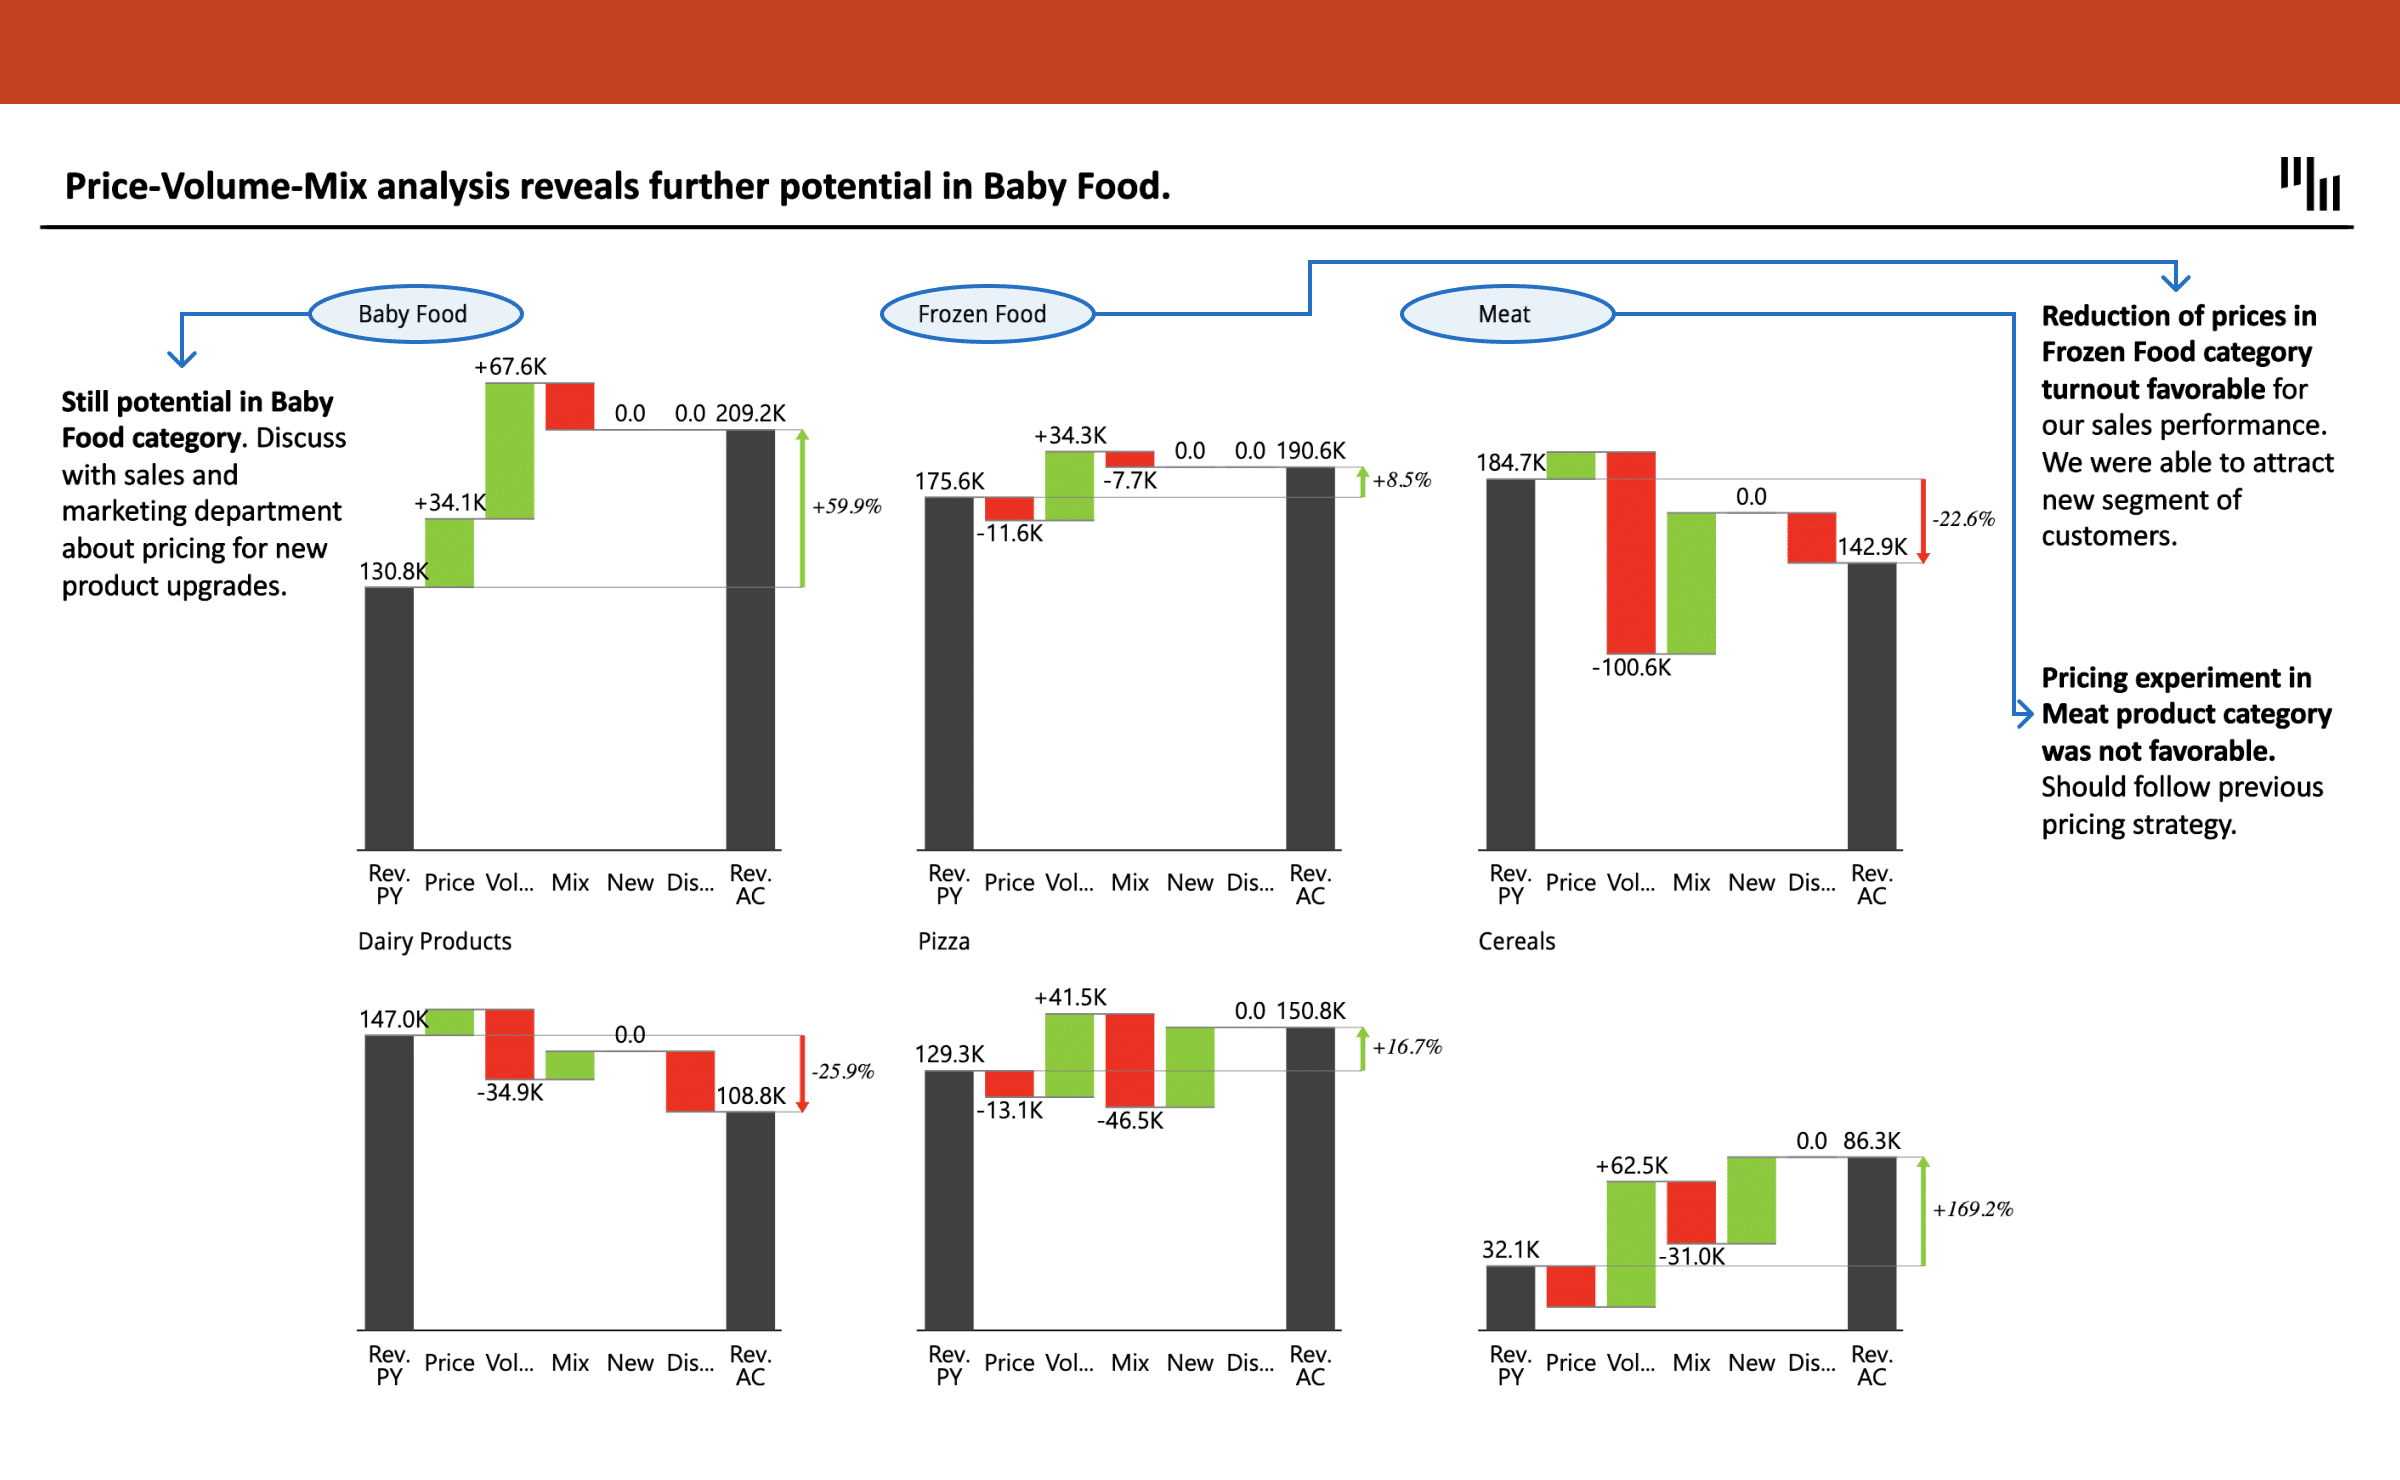
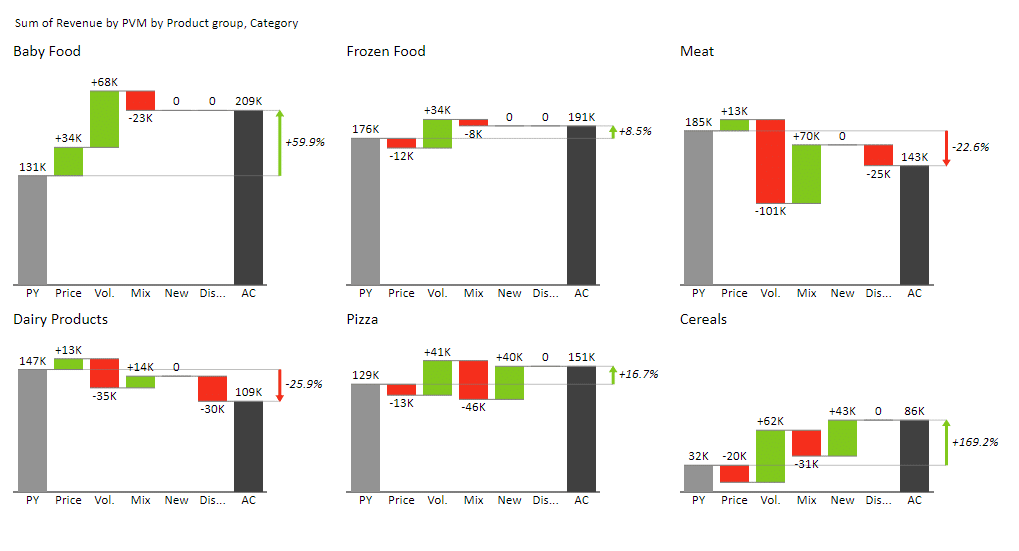
You can easily switch between waterfall, variance, column, area, line, lollipop charts or even small multiples (even when presenting!).
To dive into more details, visualize your data with comparison, hierarchical, and calculation tables with integrated charts for better understanding.
Right in your PowerPoint.
“What a great way to tell your data - I love you.”
“So amazing, even Microsoft uses it for internal reporting.”
“No more Excel hacking for chart aesthetics!”
“It made my work so much easier.”
“My reports look more professional and polished.”
“Intuitive and easy to use - Zebra BI is a game-changer.”
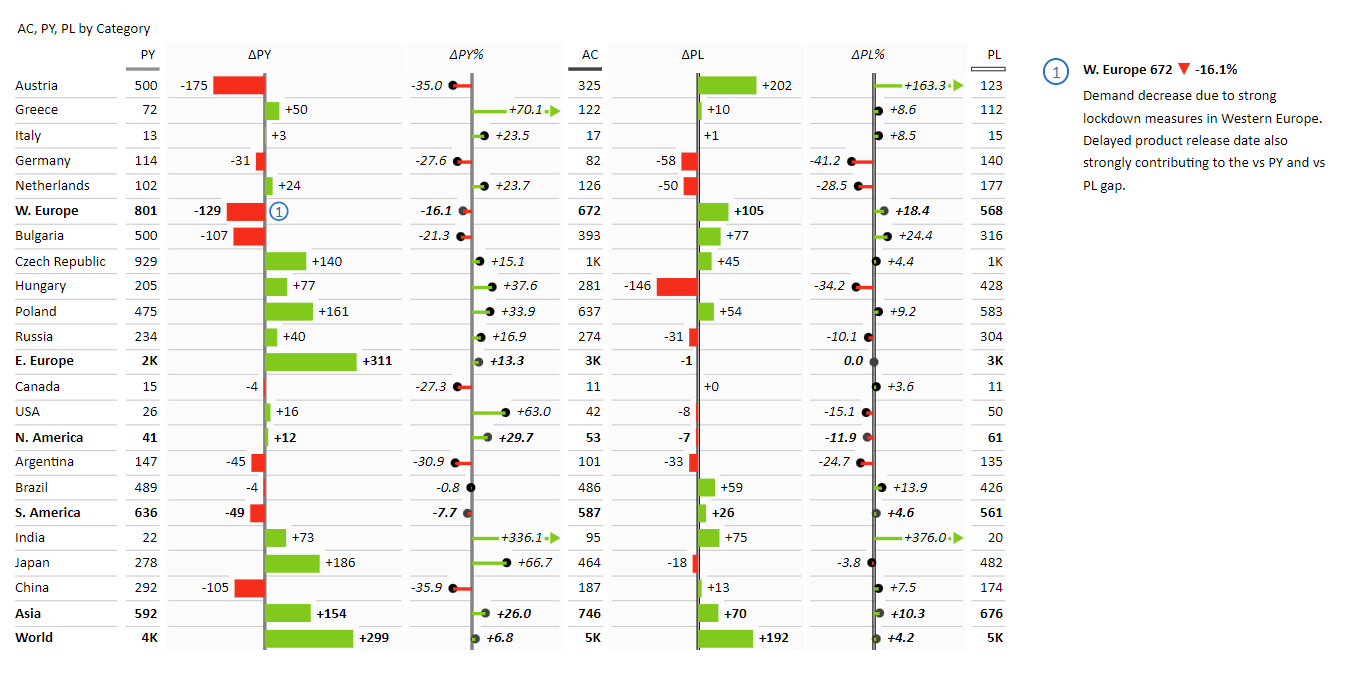
Show context not just numbers
With Zebra BI you will save time while creating reports that show just the insights you need to make the right decisions.
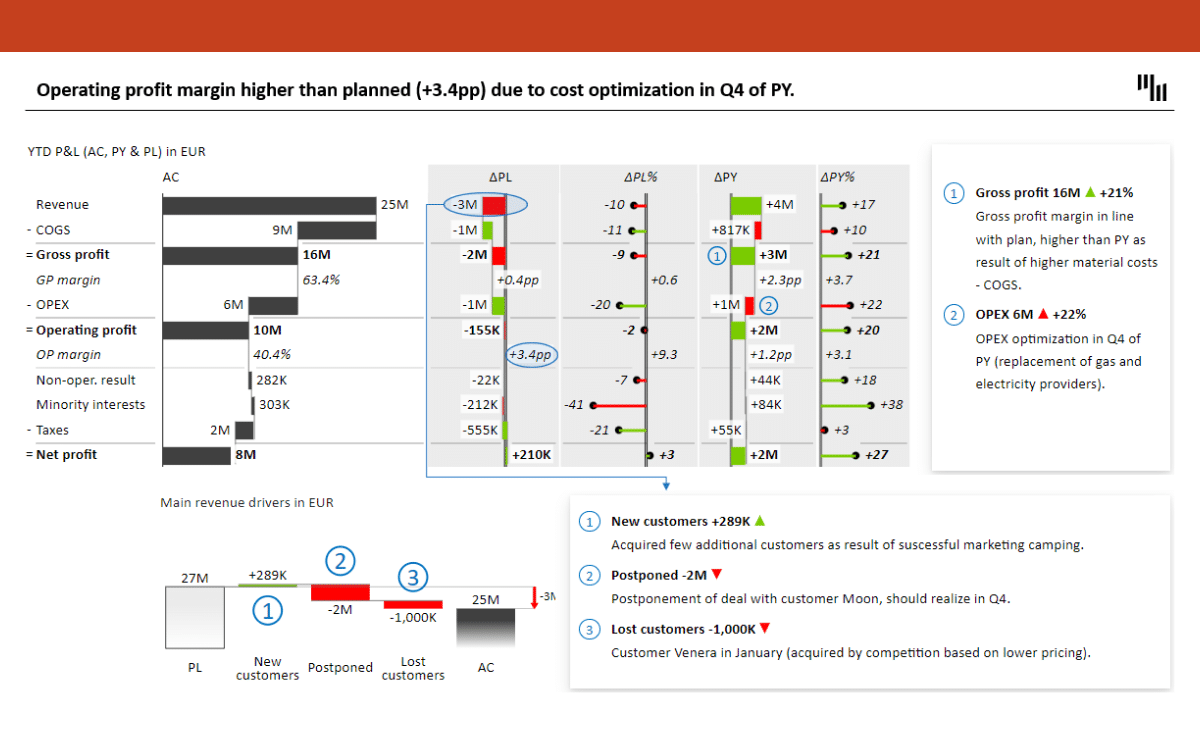
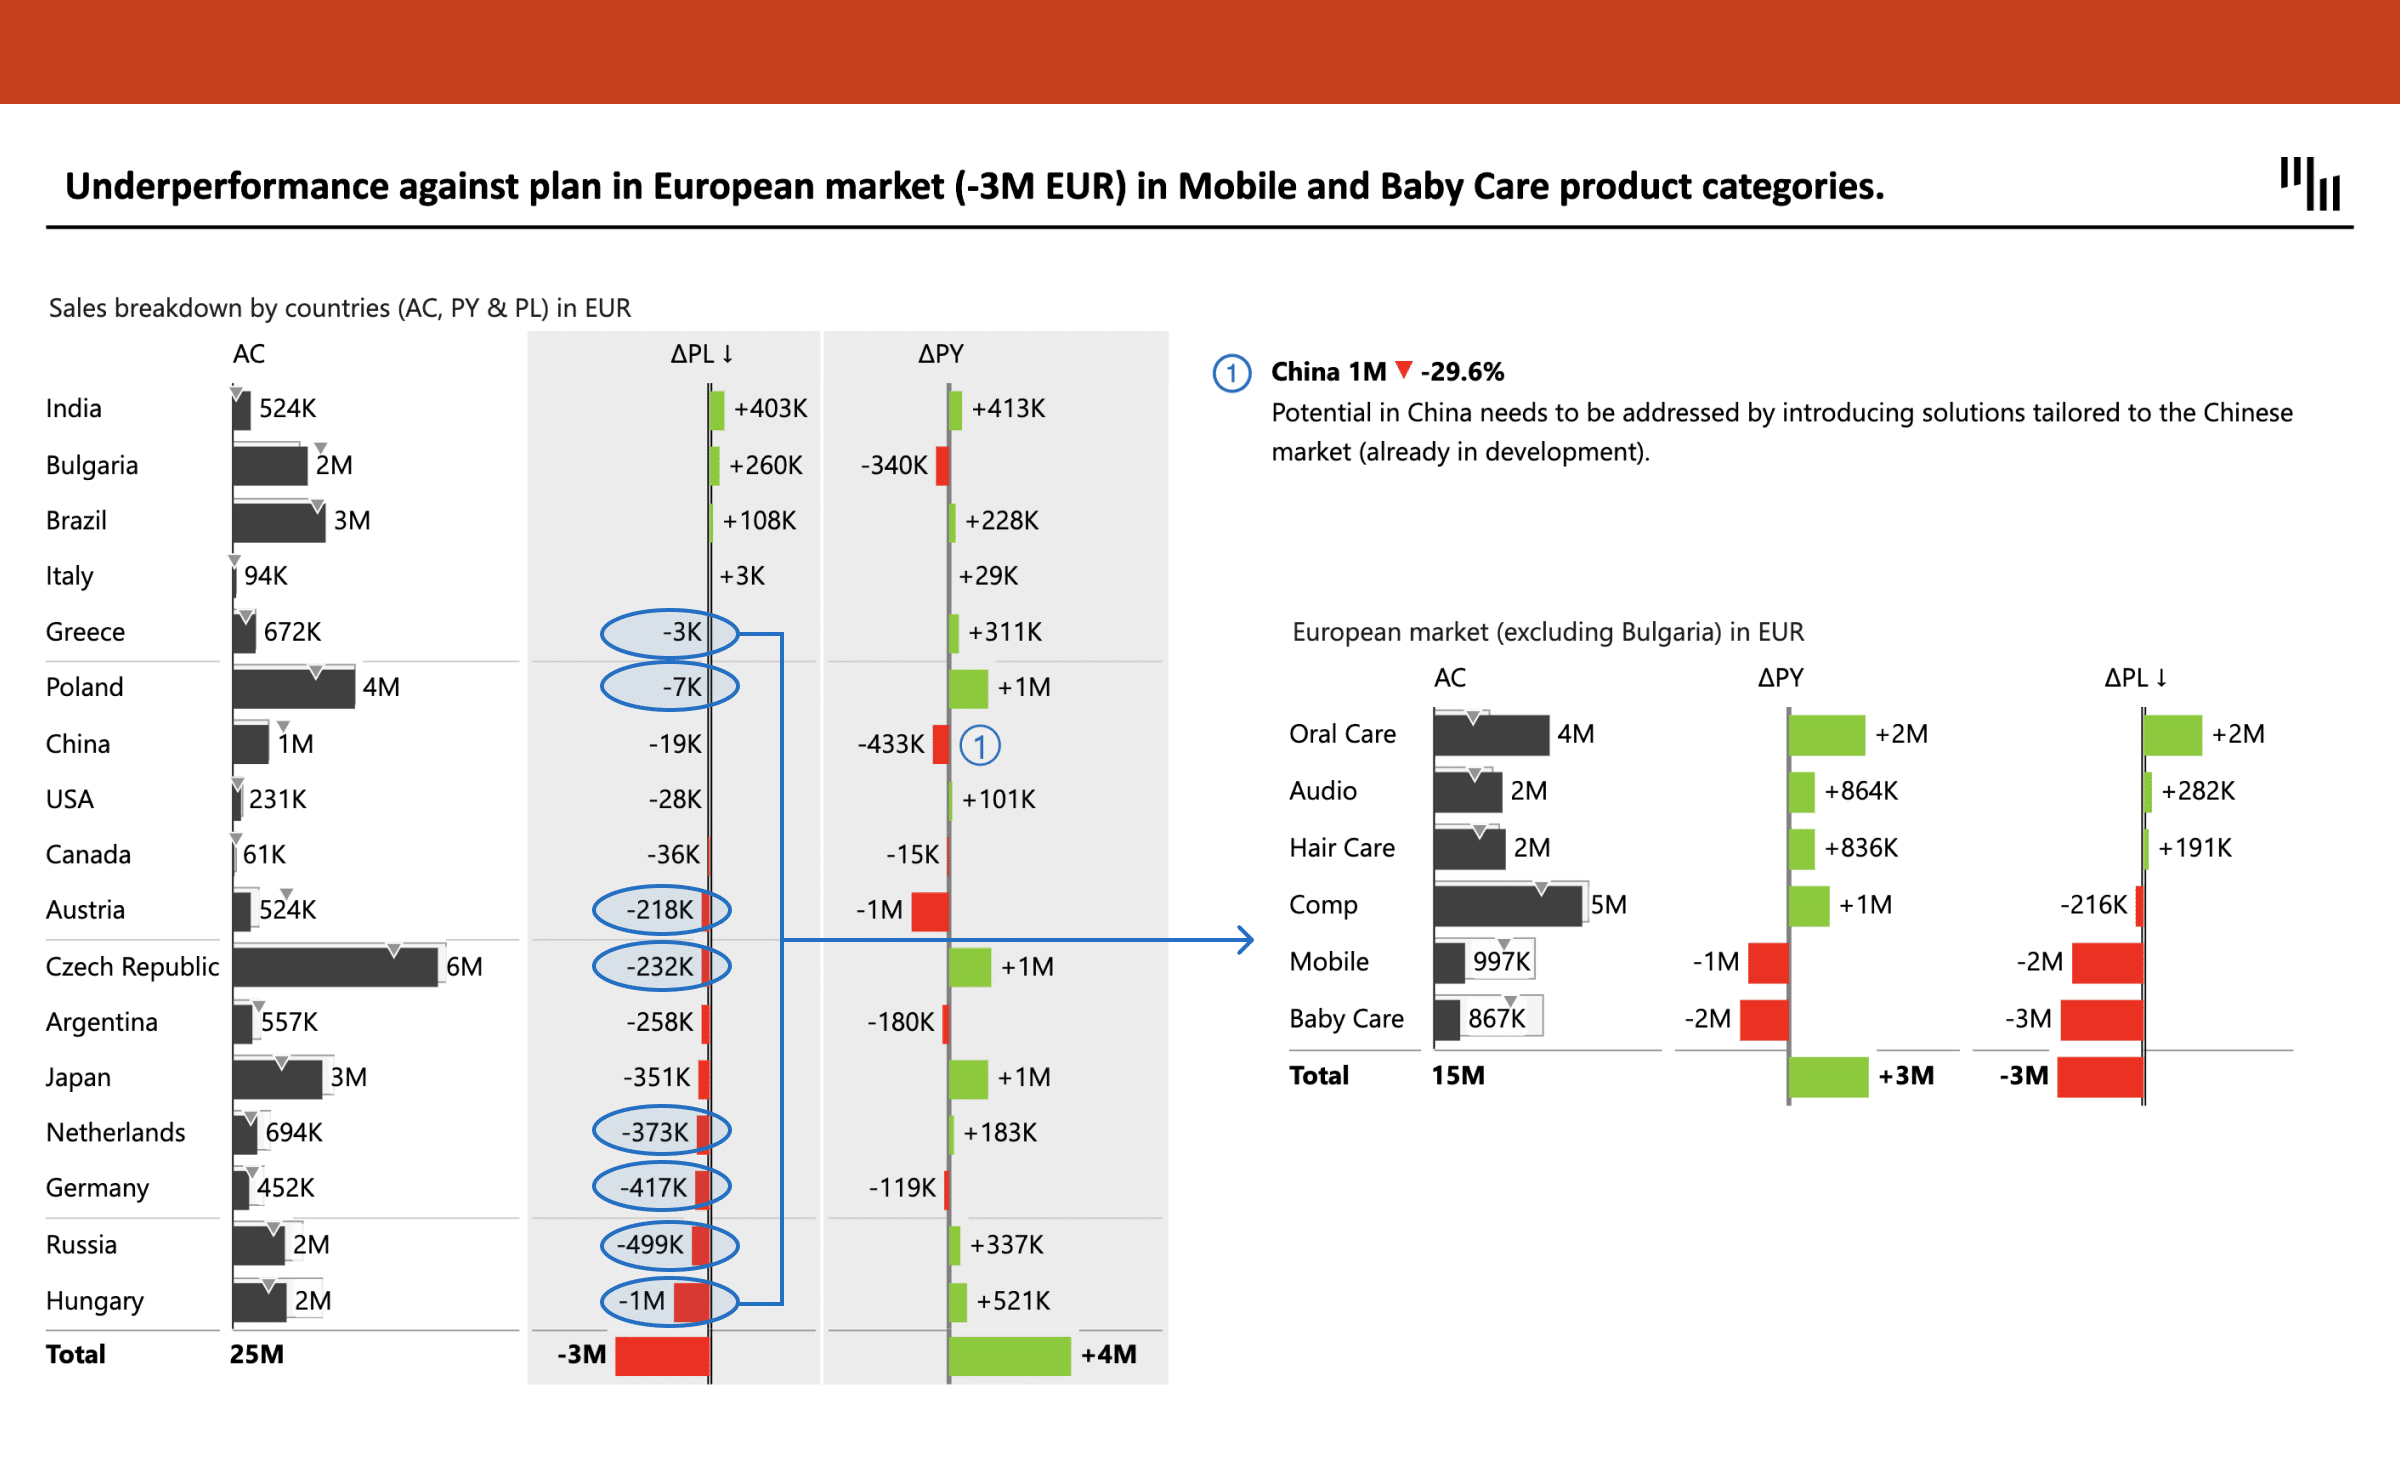
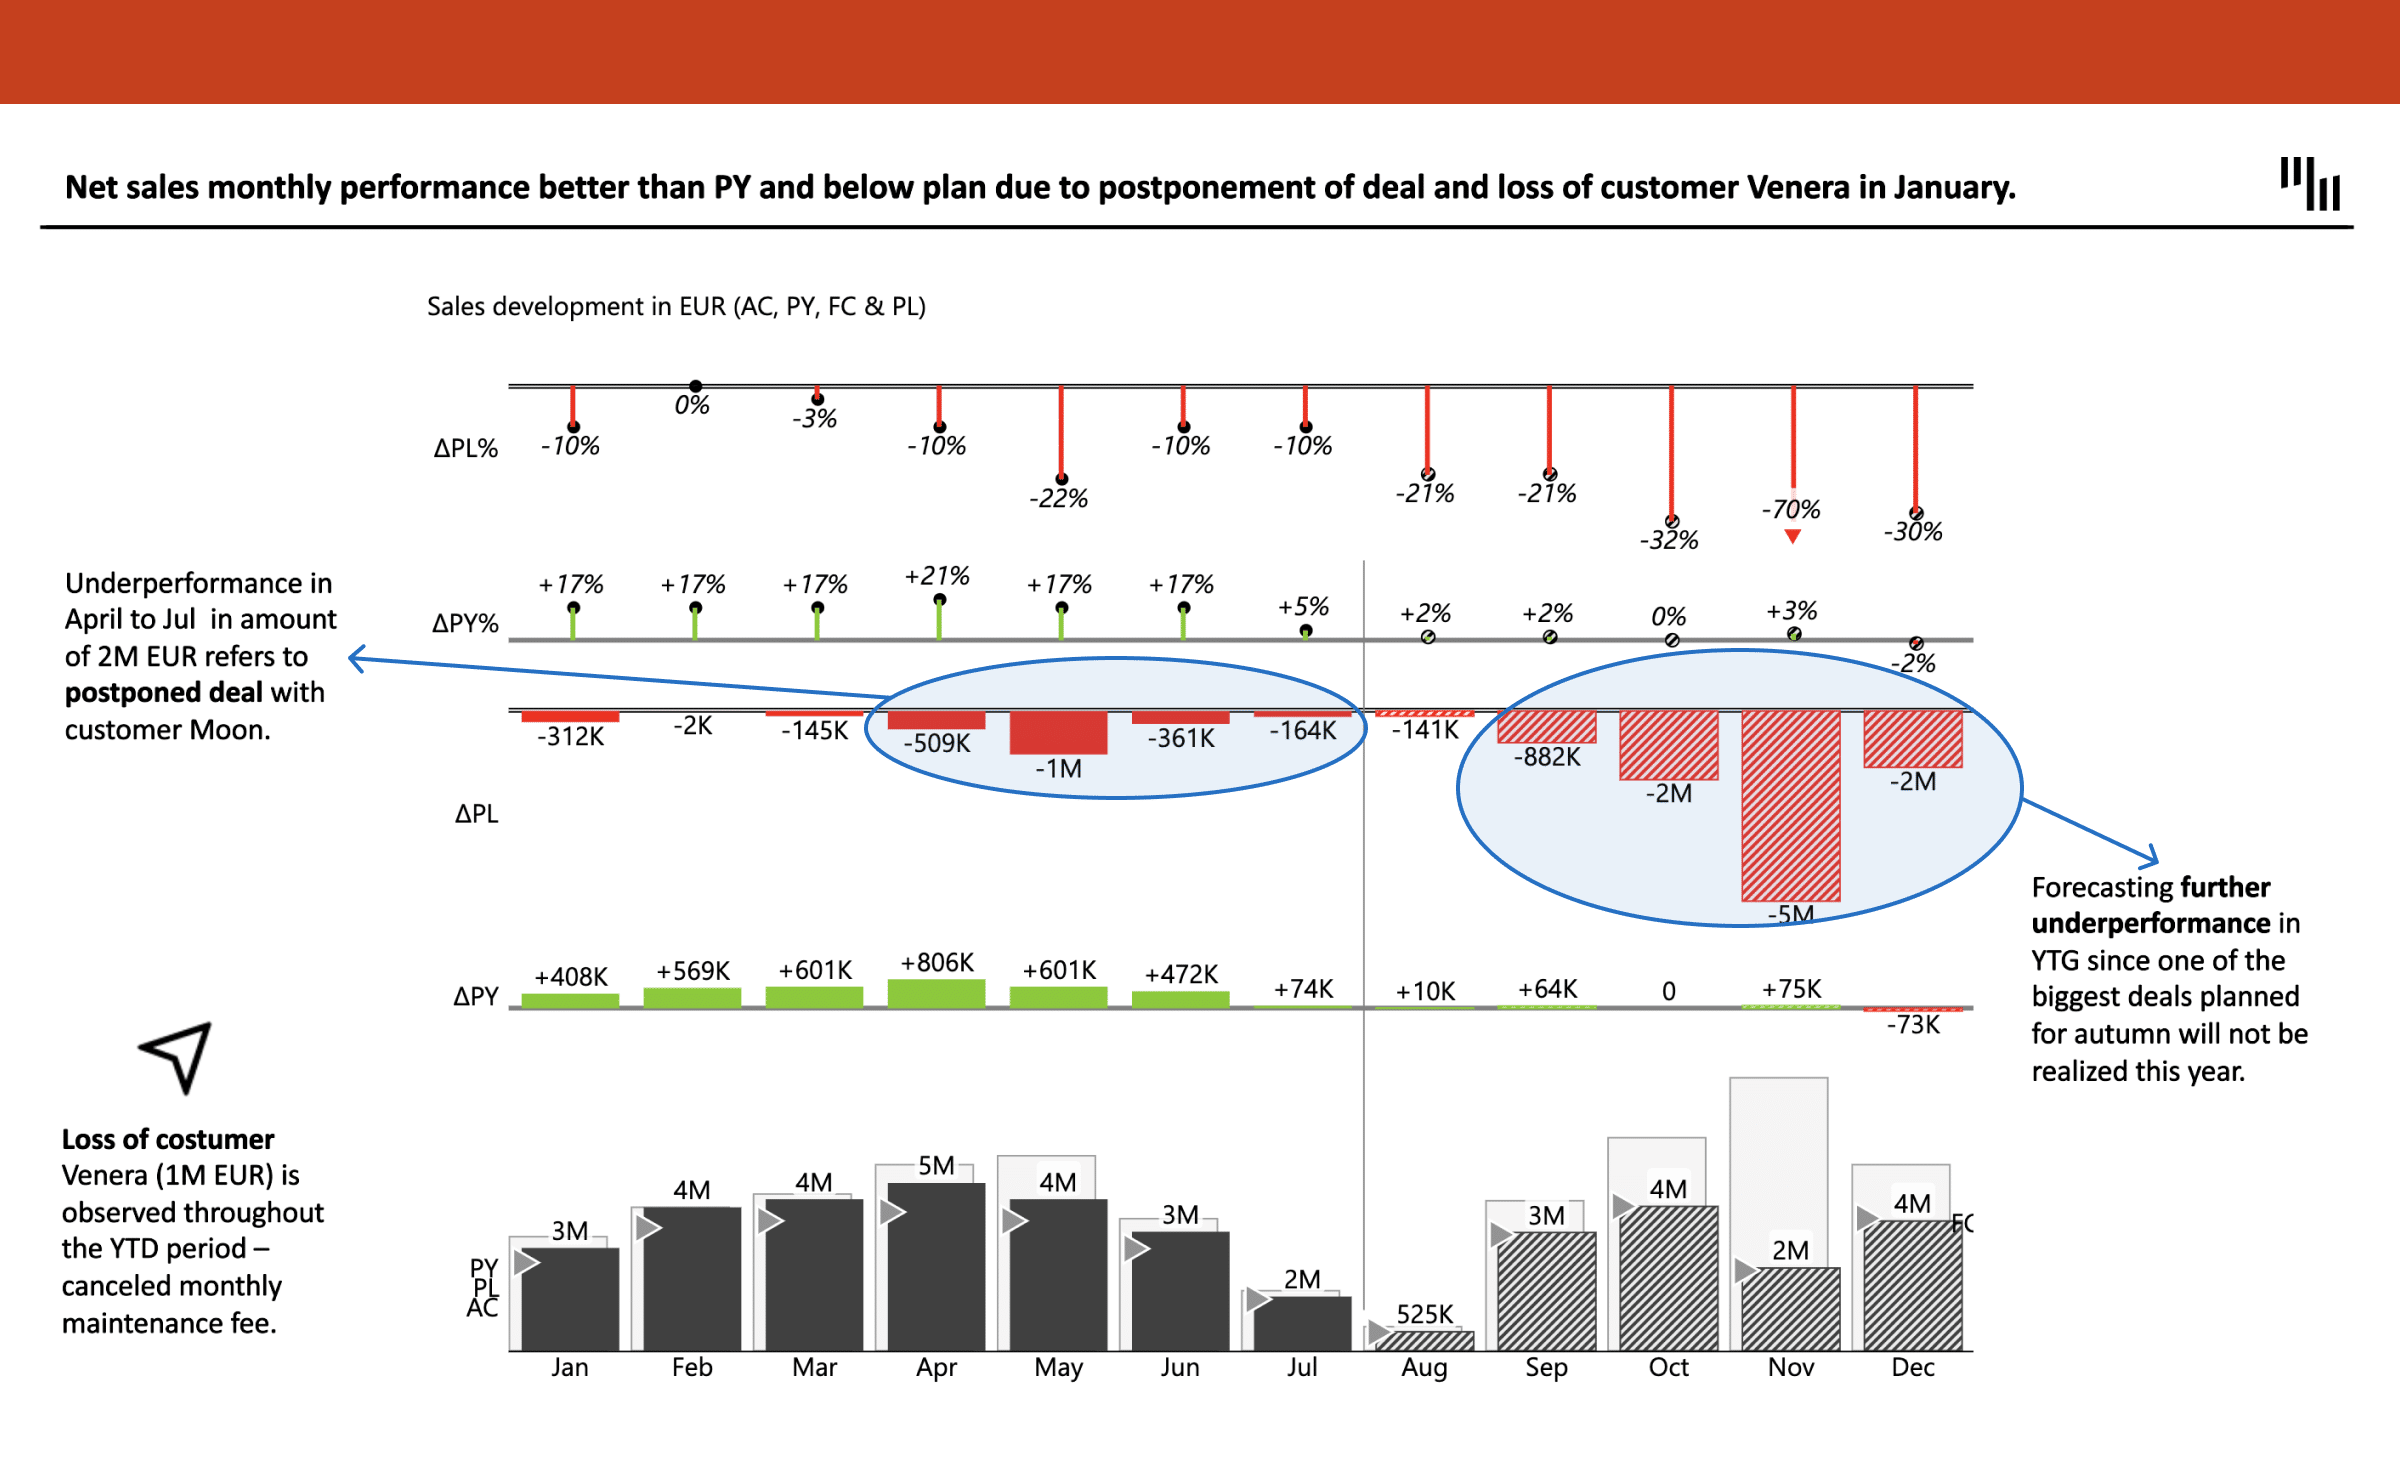
Don't just show numbers, show them compared to your plan, previous year, and forecast.
The automatically calculated relative and absolute variances will provide immediate visual information about your performance compared to targets.
Don't just show numbers, show them compared to your plan, previous year, and forecast.
The automatically calculated relative and absolute variances will provide immediate visual information about your performance compared to targets.
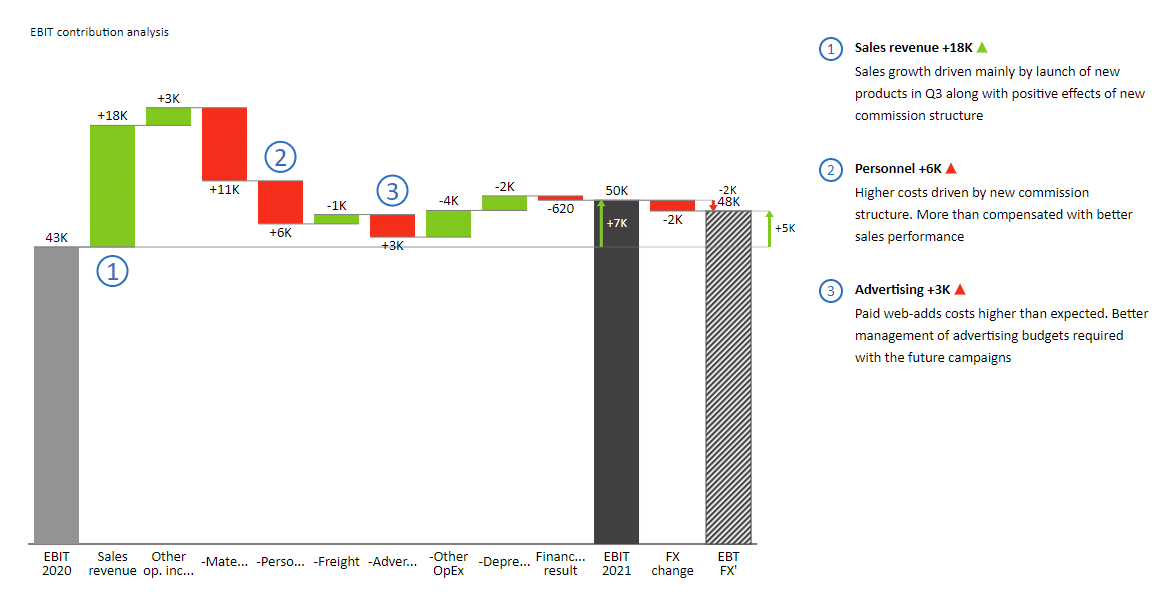
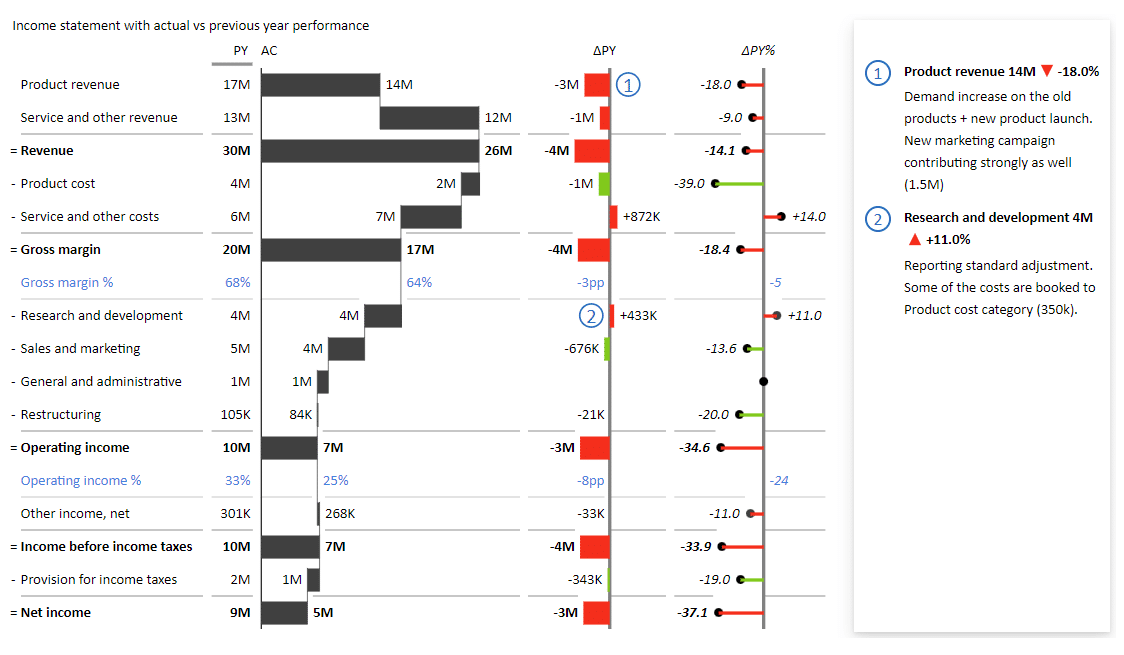
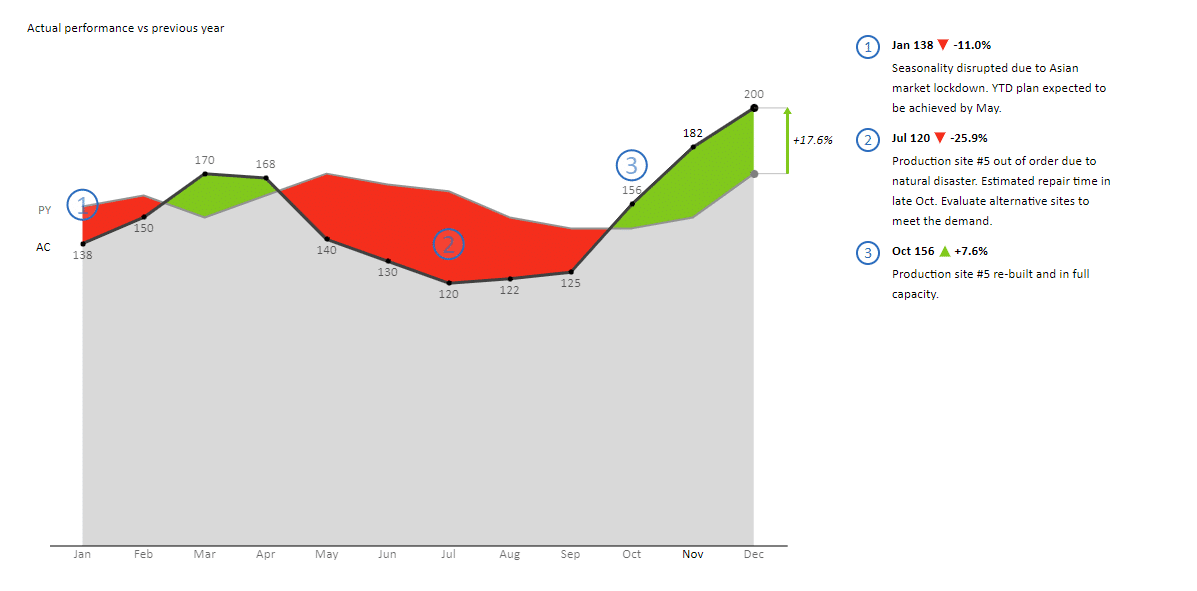
Answer the question WHY immediately
Once your performance is clear, you will probably notice some changes in the data where you will ask yourself (or others): why has this happened?
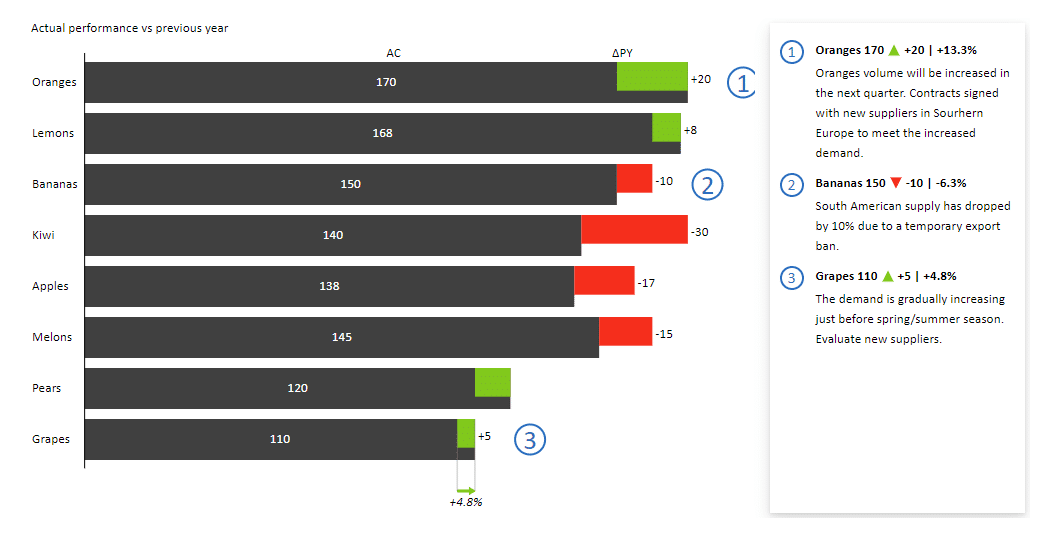
No need to dive back into data and prolong decision-making. Simply insert comments into your data source and see them appear directly on the visual.
Explore additional design settings that will help you adjust the look and feel of the comments to match your needs best.
No need to dive back into data and prolong decision-making. Simply insert comments into your data source and see them appear directly on the visual.
Explore additional design settings that will help you adjust the look and feel of the comments to match your needs best.
Seamlessly link data from Excel
Successful business reporting requires a single source of truth across multiple reporting platforms.
With Zebra BI you can effortlessly link your visualizations in PowerPoint to your datasets in Excel (which can even be connected to a Power BI source).
Before the meeting, you can refresh your source data and have the latest version available. It takes seconds.
With Zebra BI you can effortlessly link your visualizations in PowerPoint to your datasets in Excel (which can even be connected to a Power BI source).
Before the meeting, you can refresh your source data and have the latest version available. It takes seconds.
Apply your company branding
Imagine a world where all your reports, dashboards, and presentations effortlessly match your company branding.
With Zebra BI only one person needs to upload a JSON theme once. After that, all reports and slides match the branding automatically.
'Zero clicks' is the new policy.
With Zebra BI only one person needs to upload a JSON theme once. After that, all reports and slides match the branding automatically.
'Zero clicks' is the new policy.
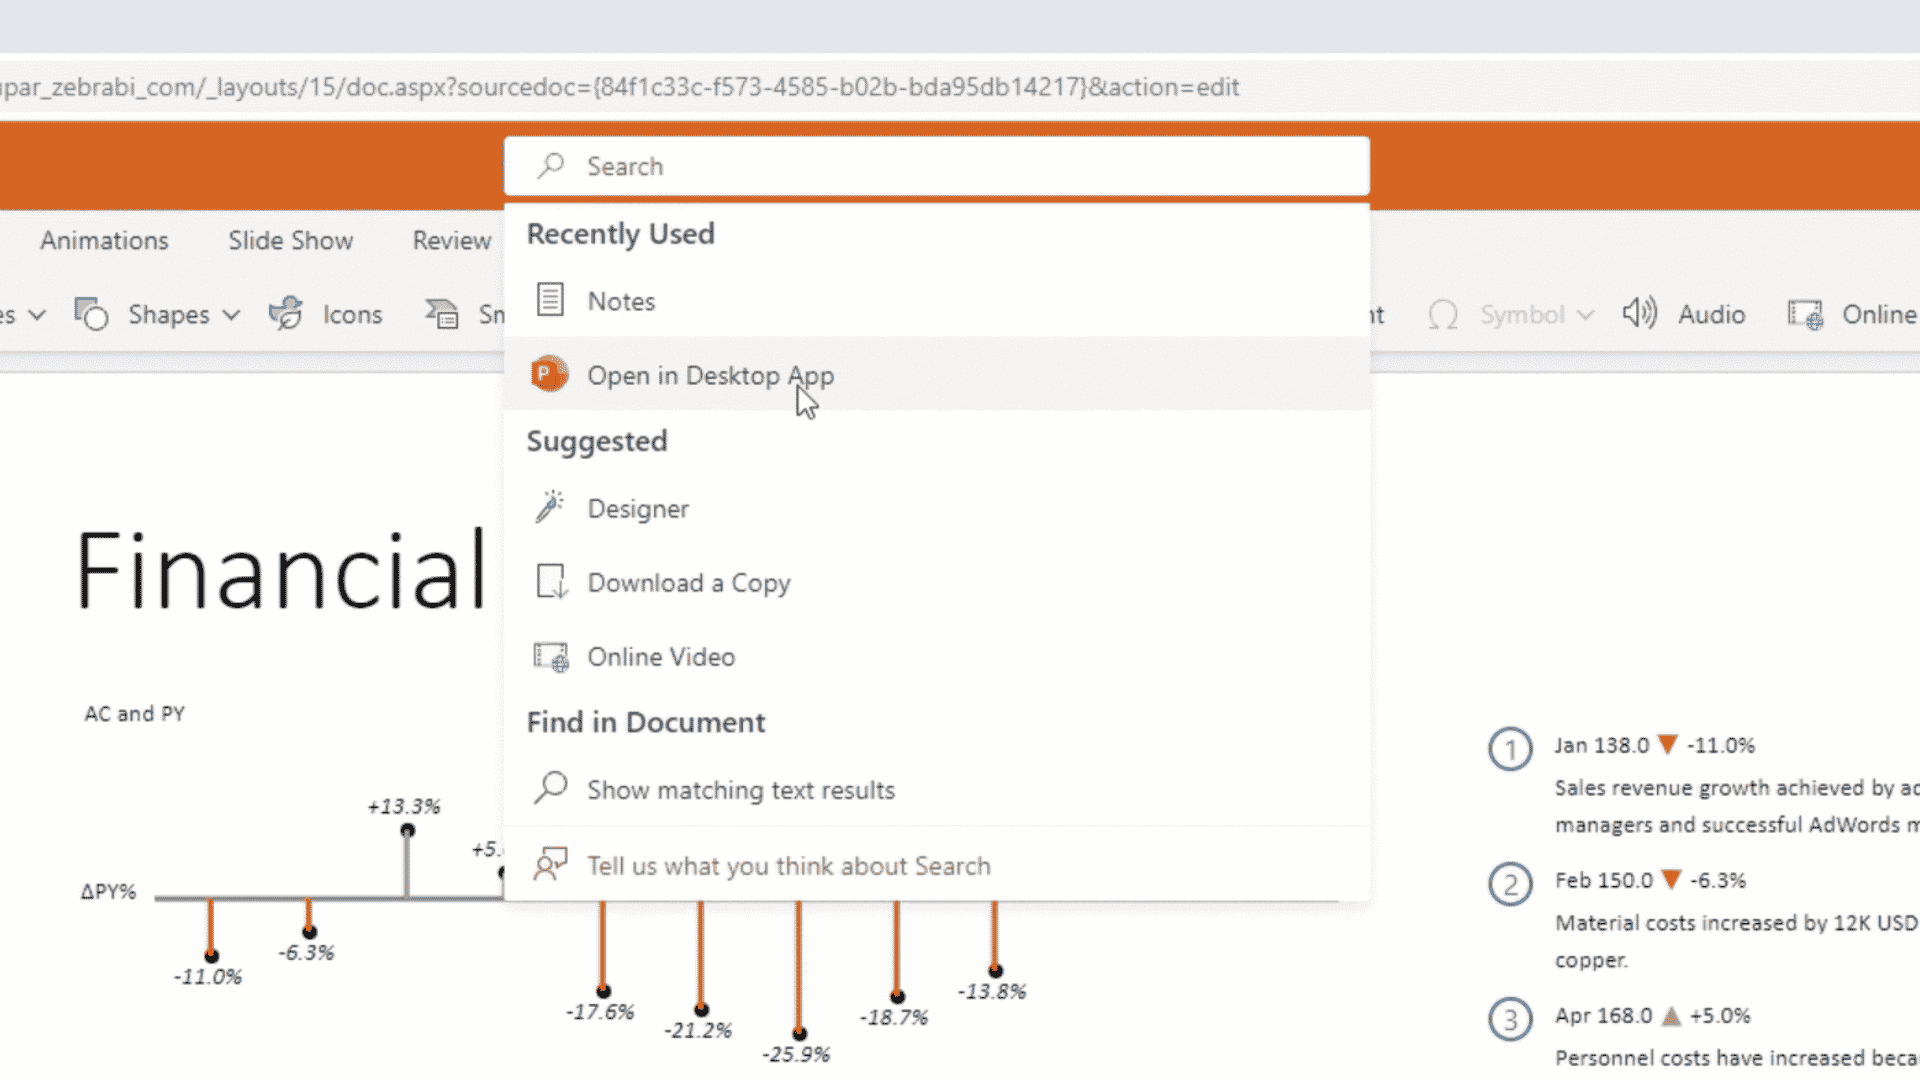
Choose where you want to work
Managers are always busy and want to consume reports online so they can check them from their mobile or tablet.
But you prefer creating reports using PowerPoint on your desktop.
Zebra BI for Office will work for both (and even for Office Apps) on Windows and Mac enabling everyone to create & consume reports wherever they prefer.
But you prefer creating reports using PowerPoint on your desktop.
Zebra BI for Office will work for both (and even for Office Apps) on Windows and Mac enabling everyone to create & consume reports wherever they prefer.
100% responsive visualizations
Zebra BI visuals for PowerPoint are the world's first fully responsive visualizations.
The visuals will automatically adapt the amount of information presented to fit the available space.
The visuals will automatically adapt the amount of information presented to fit the available space.
Trusted by the world's leading professionals

1,500,000+
data professionals leverage Zebra BI product and resources

3,000+
clients rely on our services and
trust us with their businesses
trust us with their businesses

118
Countries from across the world use Zebra BI


*Over 1 million Zebra BI users trust us worldwide. View customer by industry
Perfect for any type of business reporting
carefully designed to cover every detail
Hear it from established data experts
“This tool is unique. Most tools only show us WHAT happened. Zebra BI answers WHY it happened.”

Gabriel Medina
Analyst at GxSoft Argentina
“Our controllers now spend less time preparing comprehensive reports and more time analyzing data and crystallizing the message.”

Alejandro Meyer
Planning & Controlling Director at SanLucar Fruit
“This a highly professional product. Our company’s leadership (finance and operations) is already asking we roll this out to all our PBI financial reports.”

Joe Pawlowski
Innovation Manager - Business Intelligence, DHL
Report consistency
quick comprehension of numbers by using the right charts and colors, following IBCS standards for consistent reports.
Data security
We don't store your data. All we do is use it to render visuals in your Excel. We're GDPR and CCPA-compliant.
Not another tool =
BI consolidation
With Zebra BI you get advanced reporting and visualizations in Excel, complementing your existing BI tools and leveraging the power of millions of Excel users.
Start creating actionable slides
Open Zebra BI in your PowerPoint and see how your data turn into crucial business insights.
Try Zebra BI for free