A powerful think-cell alternative for PowerPoint & Excel
Zebra BI is a think-cell alternative that is easy to use and helps you create actionable business reports with immediate insights in PowerPoint, Excel, and Power BI.
Start with a Free Trial
Zebra BI is trusted by the world's leading experts in 129 countries


*Over 1 million Zebra BI users trust us worldwide. View customer by industry
“What a great way to tell your data - I love you.”
“So amazing, even Microsoft uses it for internal reporting.”
“No more Excel hacking for chart aesthetics!”
“It made my work so much easier.”
“My reports look more professional and polished.”
“Intuitive and easy to use - Zebra BI is a game-changer.”
Top advantages of Zebra BI as an alternative to think-cell
As one of the best think-cell alternatives, Zebra BI provides functionalities that revolve around specialized charts, tables, cross-tool and cross-device integration, ease of use, customizability, collaboration, and top-rated customer support.
✅ Works on Excel, PowerPoint and Power BI
✅ Can be used both as a desktop and as a cloud tool
✅ Eases the adoption of the reporting tool
✅ User-friendly interface
✅ Seamless integration on all devices
✅ High customizability
✅ Affordable choice for businesses of all sizes
✅ Top-rated Customer Support

Seamlessly link data from Excel and Power BI
A single source of truth across different reporting platforms is crucial for a successful business, yet it's often hard to achieve.
With Zebra BI's intuitive design, you can create an actionable visualization in PowerPoint by connecting it to an Excel dataset (which can be connected to a Power BI dataset), auto-refresh all visuals in one go, and collaborate in the cloud seamlessly. Before the meeting, you refresh the data, and, voila, you're ready.
This way, everyone is looking at the same version of the data and making the right decision.
Promote collaboration & data-driven decisions
Collaboration is effortless with Zebra BI, eliminating barriers and aligning teams with the same data. By connecting platforms like Excel, Power BI, and PowerPoint through Zebra BI, team members can seamlessly share insights, visualize trends, and collaborate in real-time. The visual clarity, cross-platform and cross-device functionality, and the single source of truth all foster data-driven teamwork, and enable the team to focus on:
✅ Analyzing data holistically;
✅ Drawing actionable insights instead of scattered or outdated information;
✅ Quickly spotting trends, tackling challenges, and seizing opportunities

Stellar customer support, actually there for you
Zebra BI stands out not just for its innovative features but also for its dedication to exceptional Customer Support. Our team prioritizes responsiveness, ensuring that users receive timely and effective assistance whenever needed.
Whether it’s troubleshooting a technical issue or guiding users through advanced functionalities, Zebra BI's support team is committed to providing a seamless experience.
This hands-on approach to customer care fosters trust and satisfaction, allowing clients to focus on maximizing the tool’s value for their business. By continually addressing user feedback and offering comprehensive resources, Zebra BI ensures that customers not only overcome challenges but also thrive in their data-driven endeavors.
Don’t believe us? Check out our customer testimonials and find out why Zebra BI is one of the best think-cell competitors.
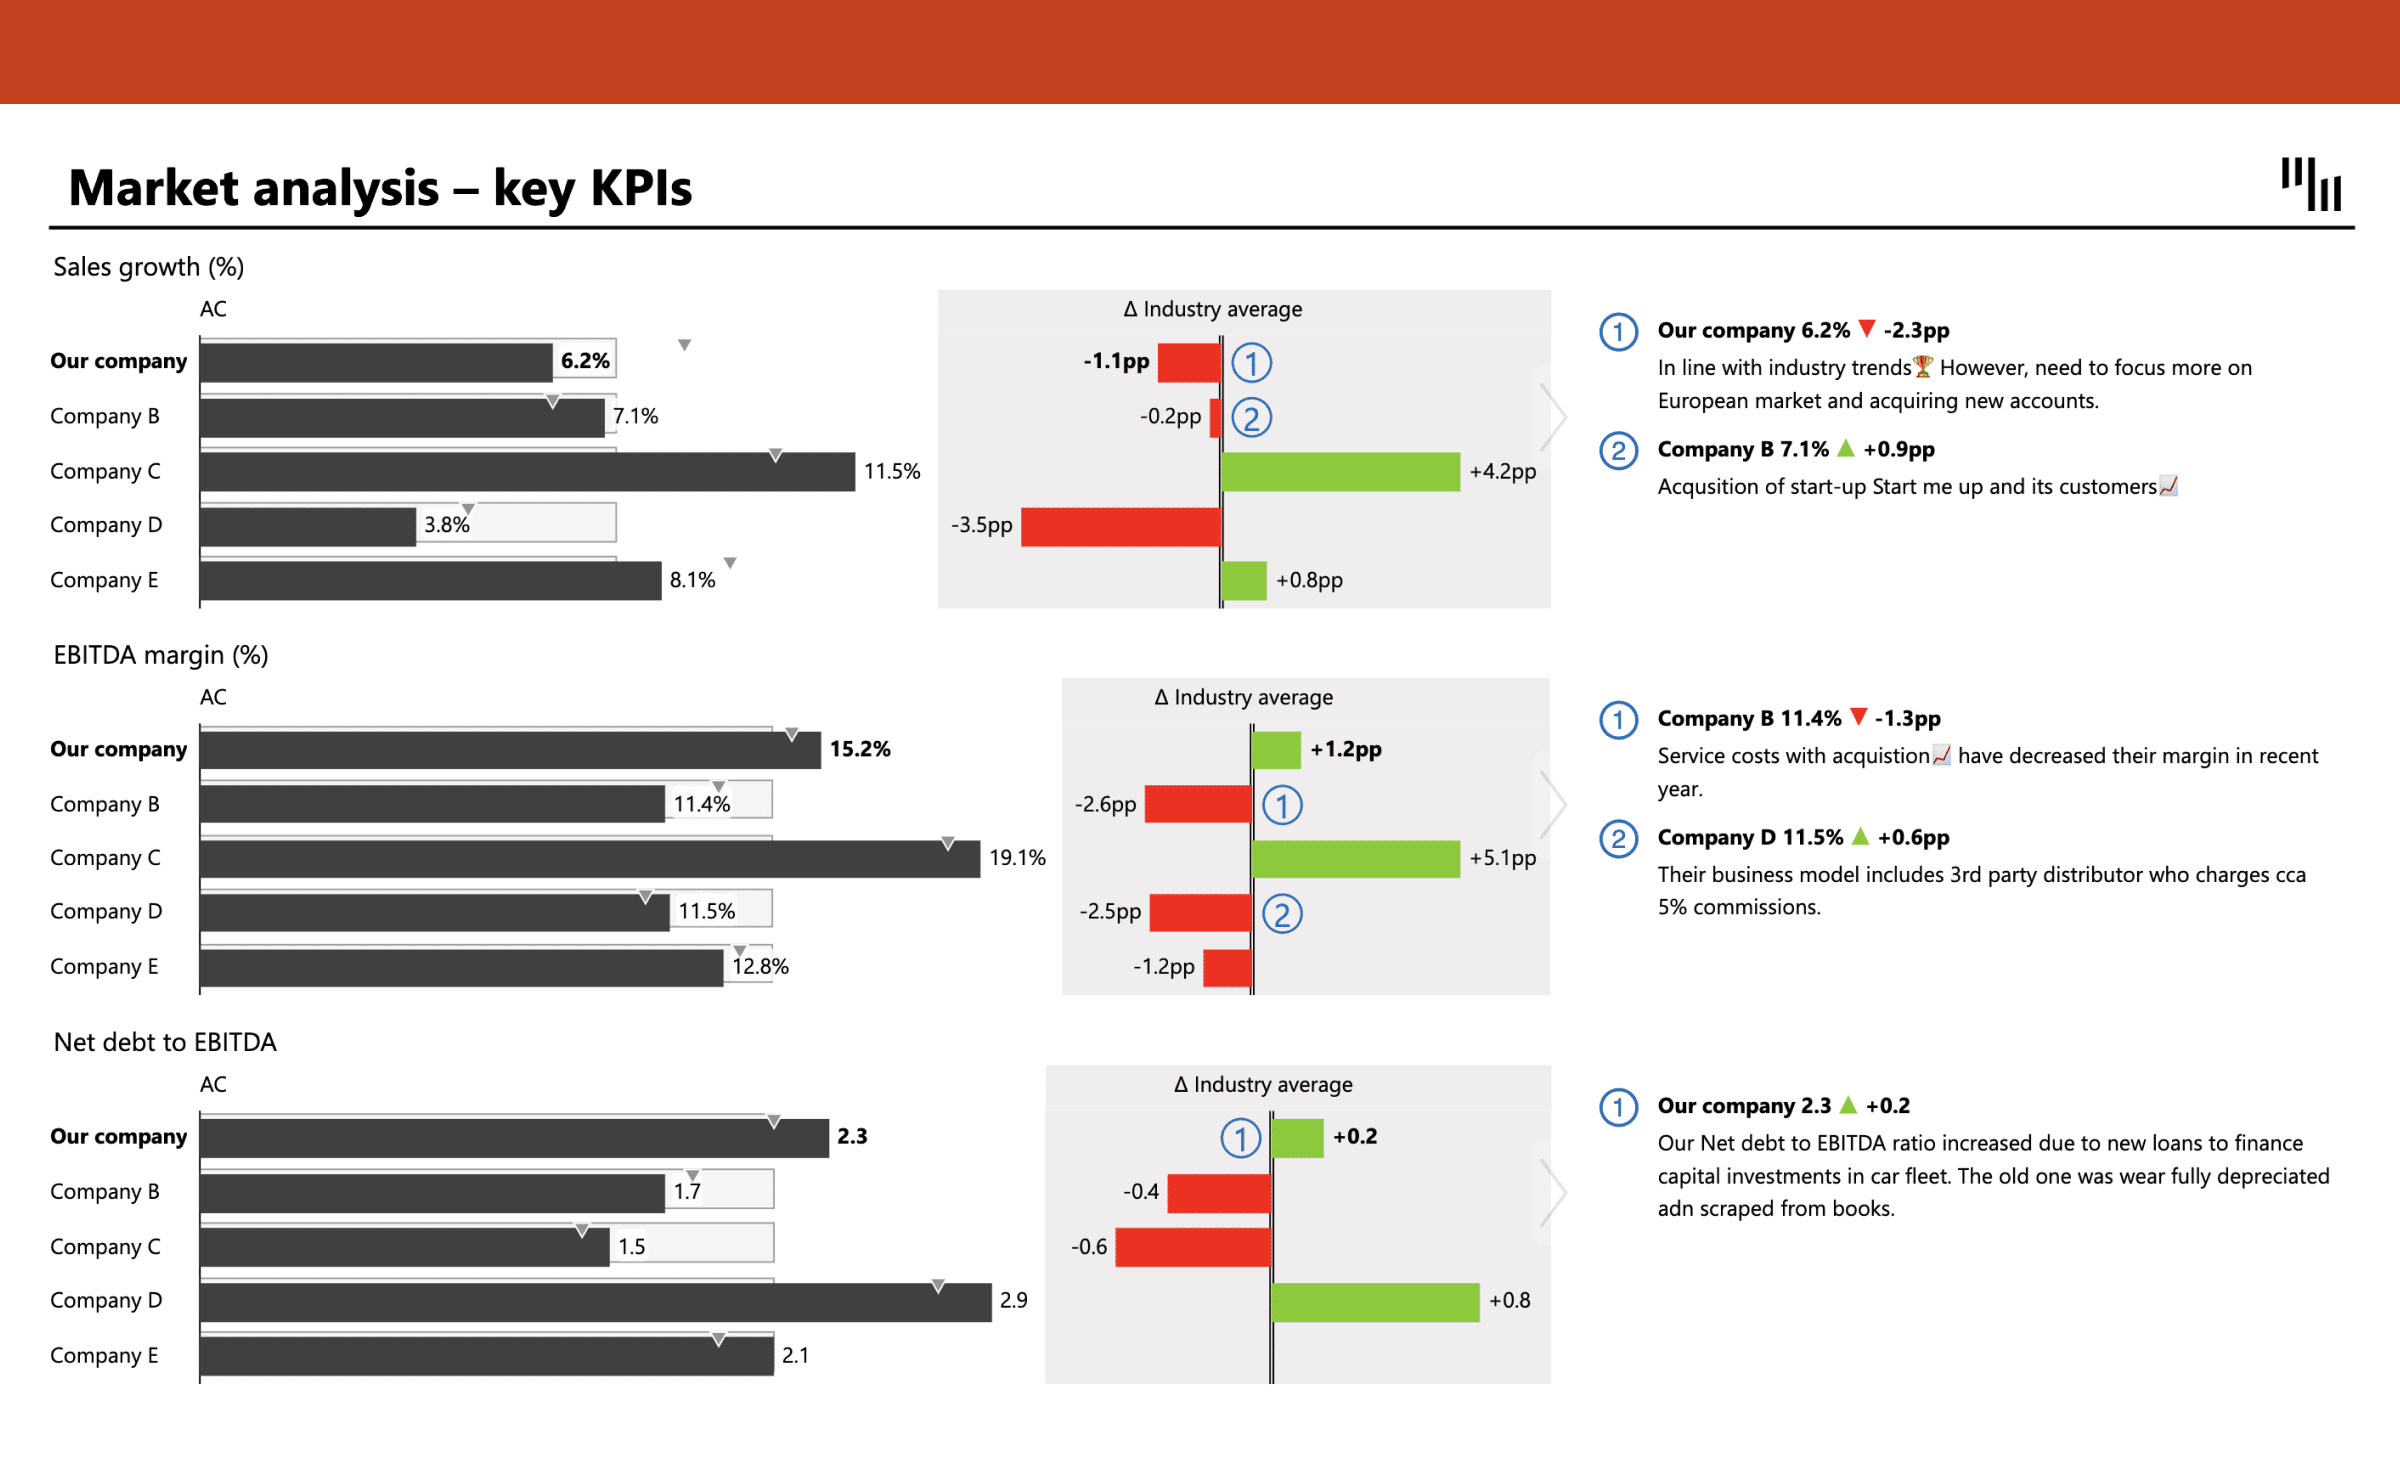
30+ advanced charts & tables
While think-cell is a tool for creating nice charts as a PowerPoint add-in, Zebra BI is a great think-cell chart alternative as it acts as a complete chart maker, table maker, and Power BI card maker with a full stack of all the advanced charts & tables you need in Excel, PowerPoint, and Power BI.
What's more, our tool is specialized in creating business visuals that follow the best practices in the field, straight out of the box.
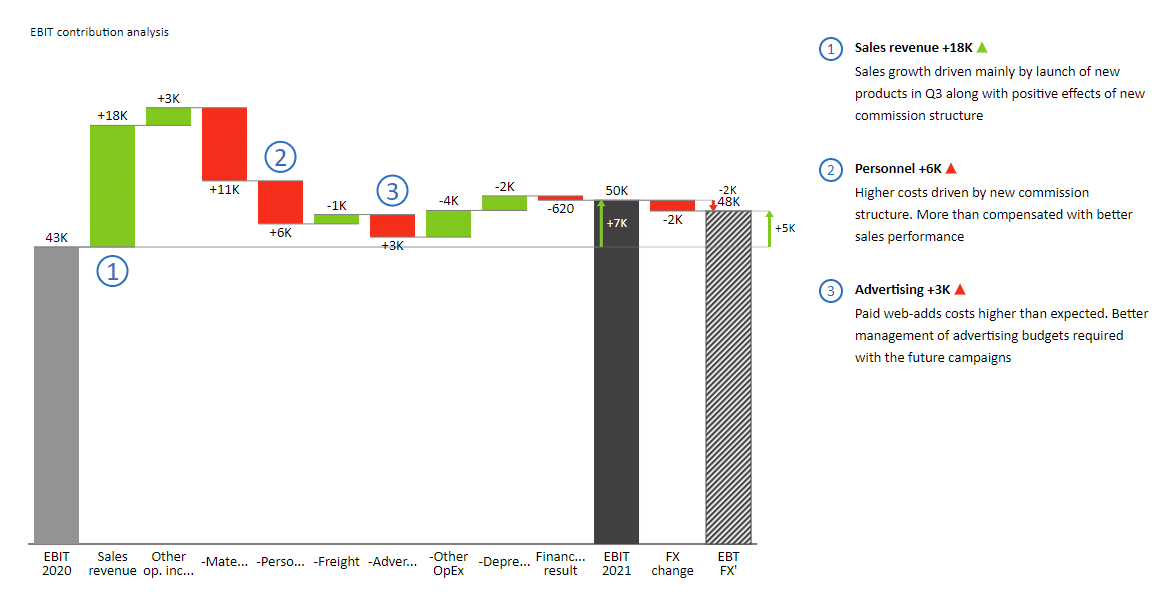
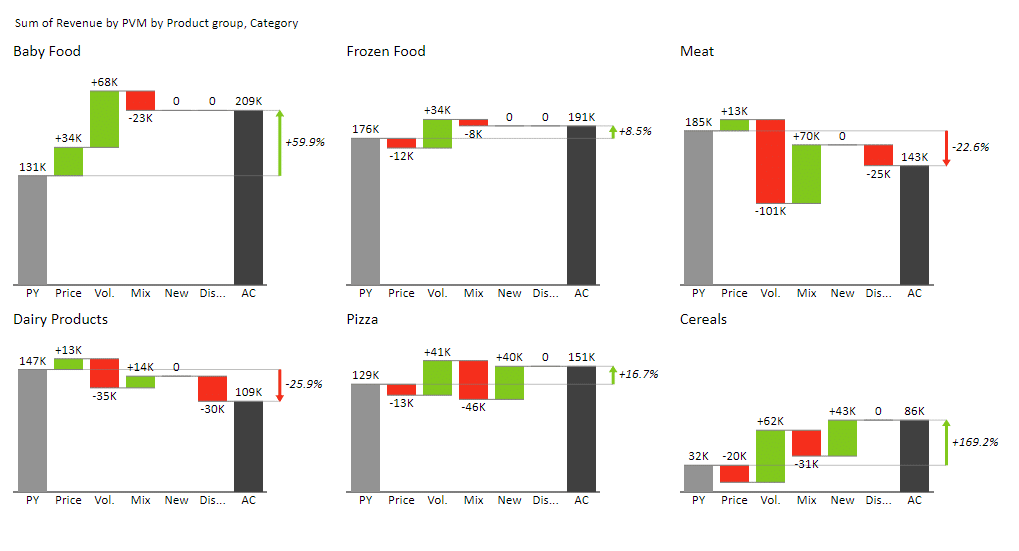
Zebra BI is a think-cell competitor that enables automated table and chart creation for every need you may have: from simpler business charts like bar charts, column, area, bar, lollipop charts, or single-comparison tables to complex charts like waterfall charts with difference highlights, small multiples, integrated variance charts and tables, and calculation tables.
In other words, any financial charts you might need, Zebra BI's got them. All this can be done in a user-friendly interface, in just a couple of clicks, so you don't waste time with tedious settings.
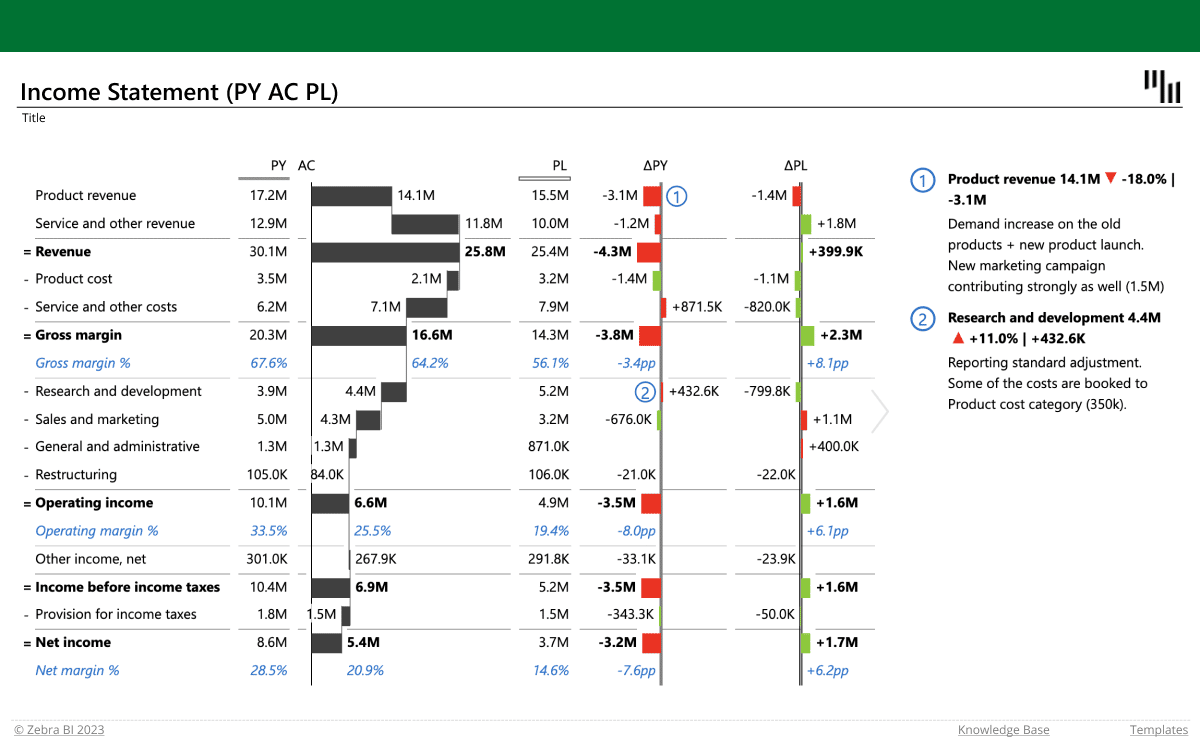
All the 'must-have' features for 2025
What was a breakthrough tool in 2003 is no longer enough in the fast-changing business world.
Zebra BI's regular software updates provide users with out-of-the-box advanced features created according to the latest reporting best practices.
Our software tool was built as interactive presentation platform that allows you to generate integrated charts across your entire tool stack: Excel, PowerPoint, and Power BI alike.
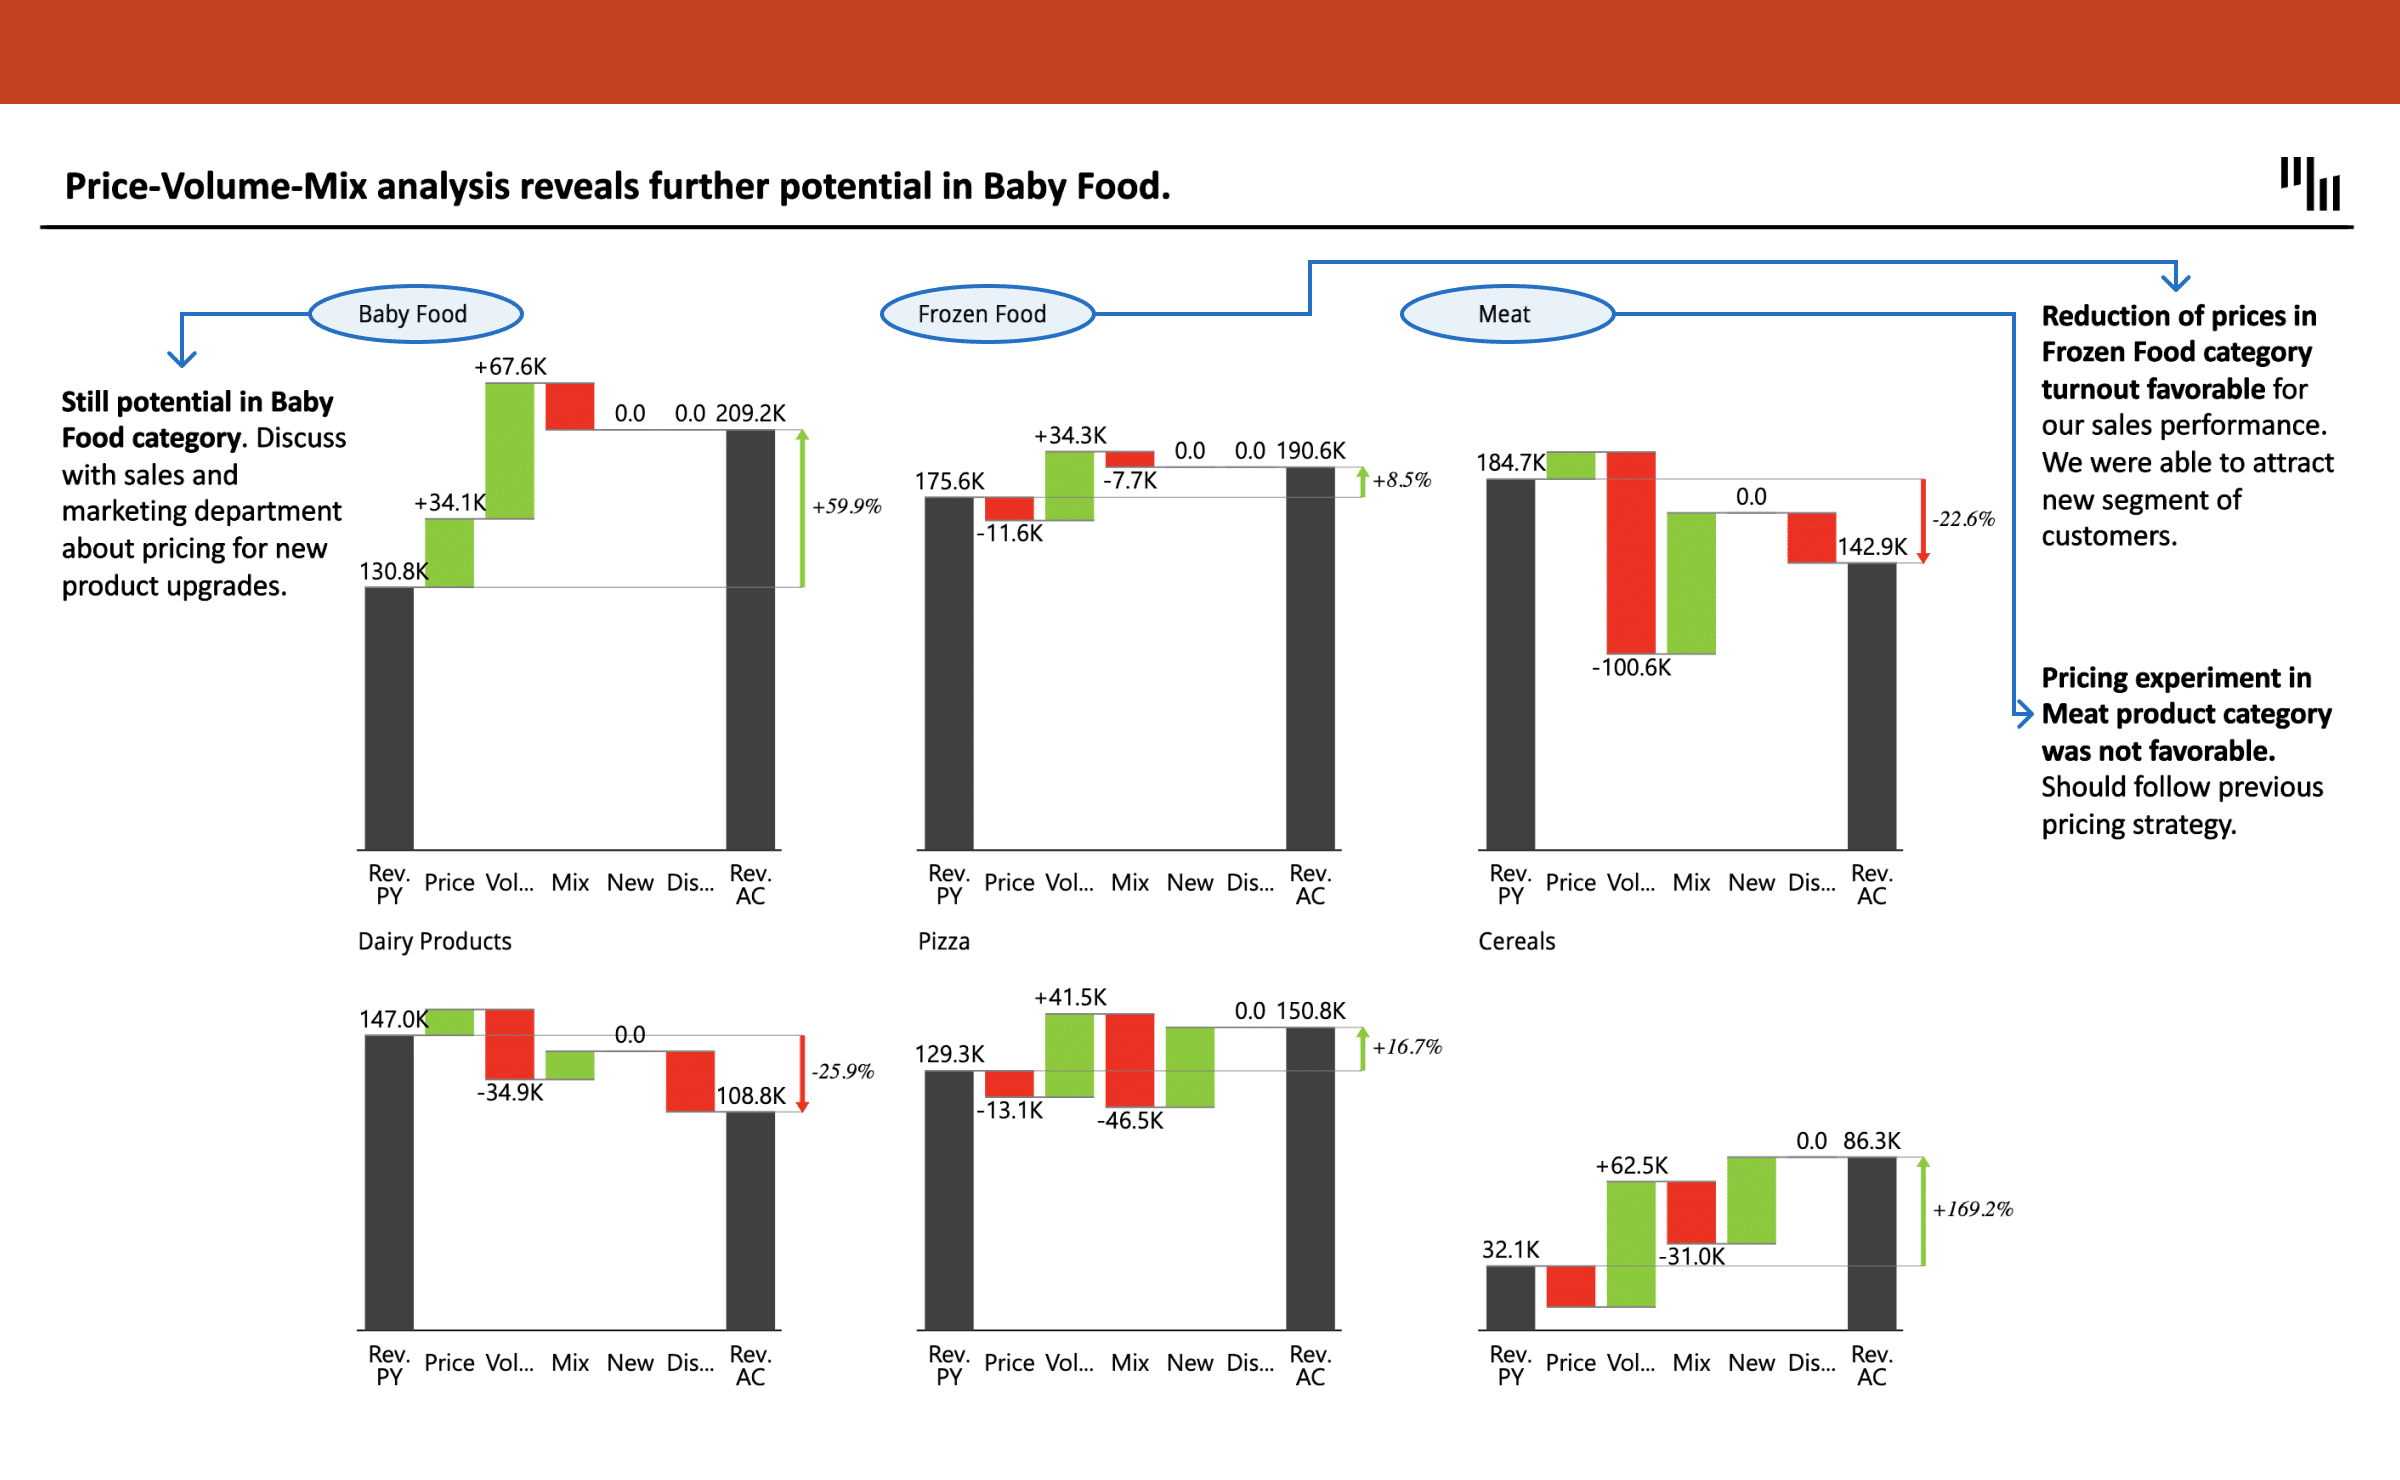
Zebra BI is a platform for teams with complex needs, like:
✅ Creating charts with up to three comparisons (actual vs. plan vs. previous year vs. forecast)
✅ Creating tables that include more than one version of plans and forecasts
✅ Implement automatically calculated relative and absolute variance
✅Using chart and table sliders
✅ Incorporating custom calculations on the fly, without interfering your dataset or data model
✅ Sorting and highlighting data
✅ And more (so much more!)
Plus, as a think-cell competitor, Zebra BI provides you with all the dashboard, table, and chart templates you need to make your job easier. Just grab whichever of the tens of templates we have for Excel, PowerPoint, and PowerBI, customize it in a few clicks, and use it as you please.
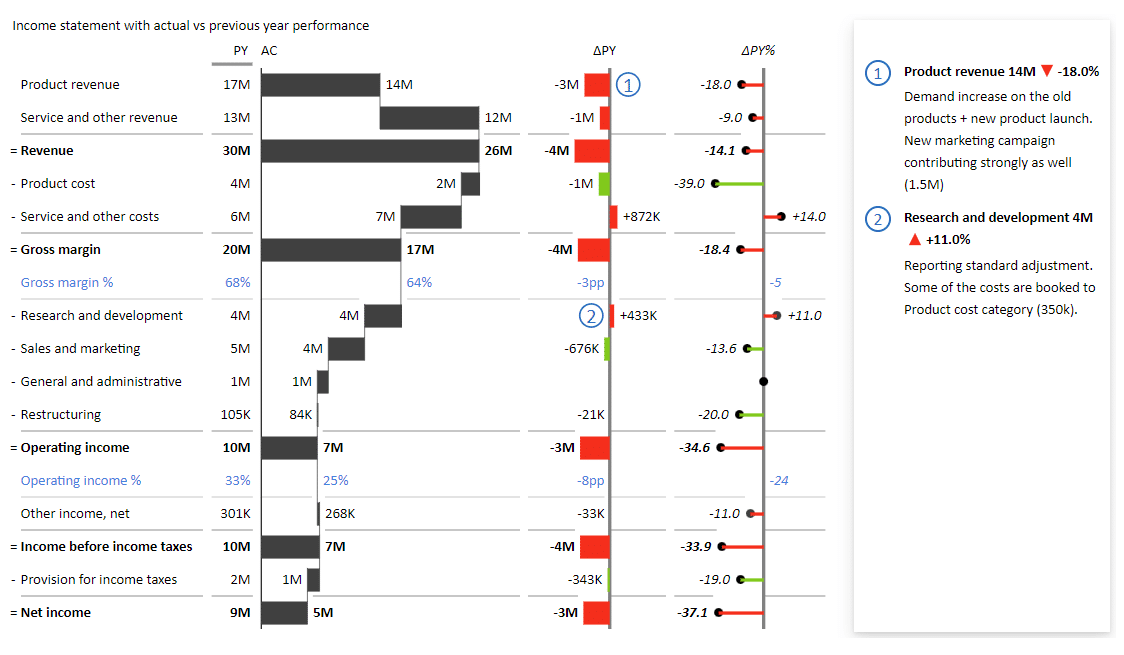
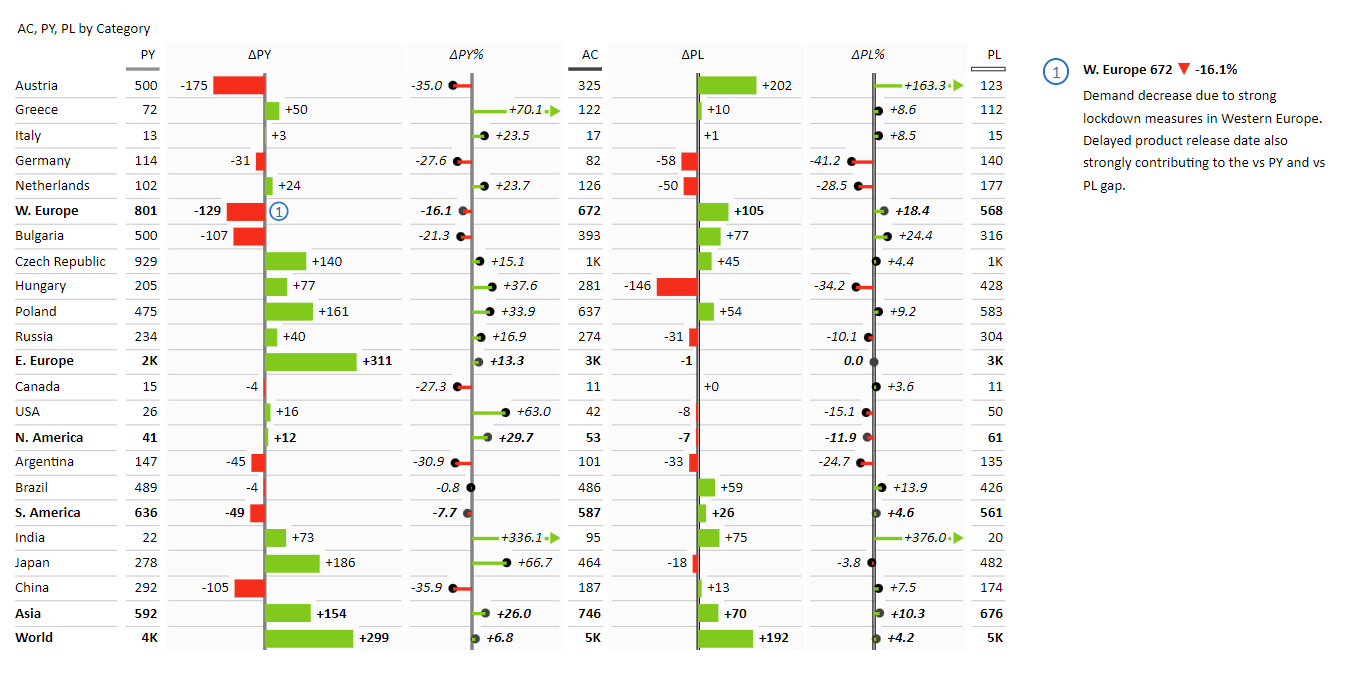
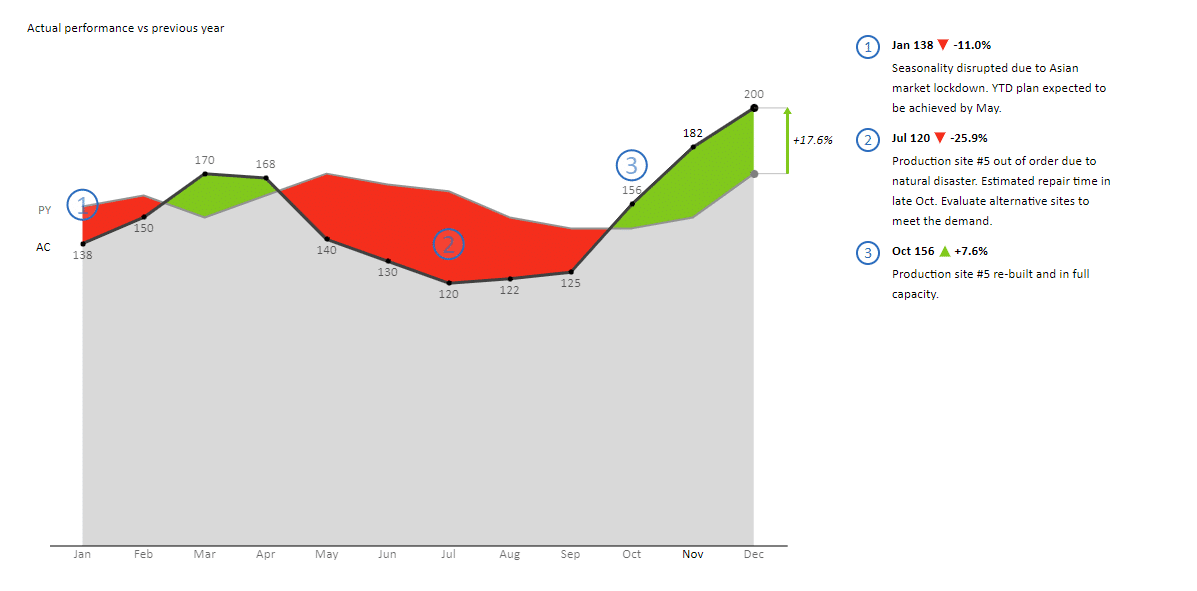
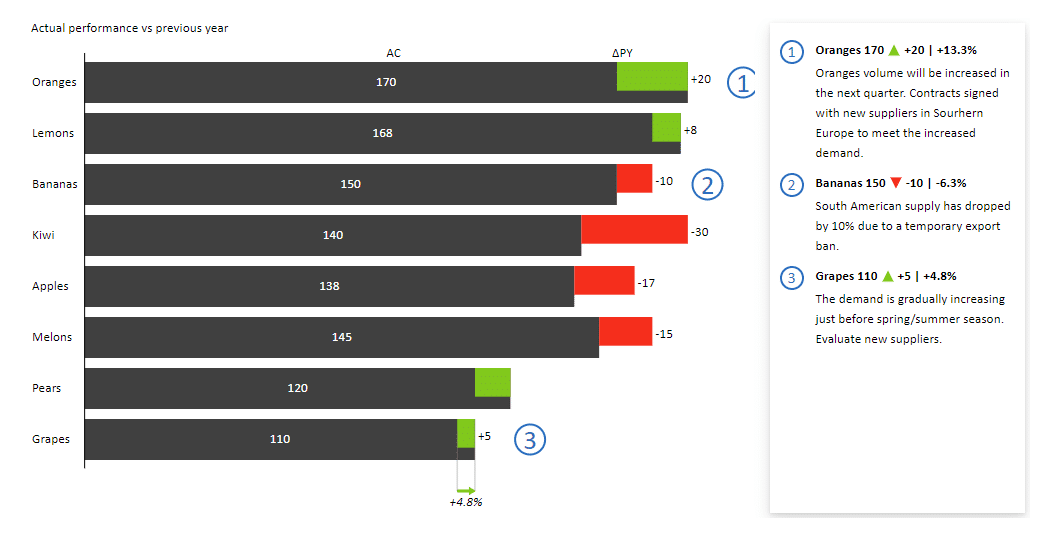
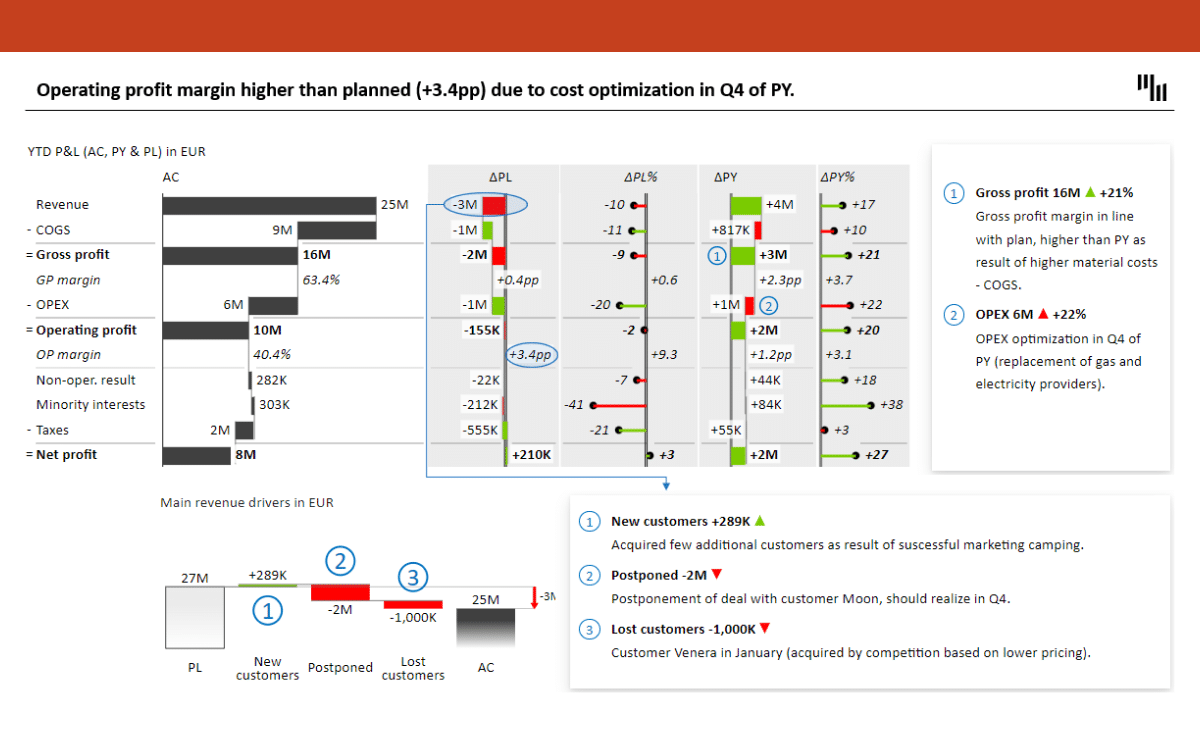
Integrated comments for more context
It often happens that just seeing the numbers doesn't give you the complete picture of what is going on with your performance.
To avoid making any decision without 100% knowing the circumstances, Zebra BI offers the integrated dynamic commenting option, explaining the why behind the numbers.
Simply add comments to your data source and give your report viewers a full understanding of the key business information, all in the same document, without having to write long chunks of text in a separate document, message, or text boxes.
Automatically applied company branding
Imagine a world where all your reports, dashboards, and presentations effortlessly match your brand-compliant design guidelines.
With Zebra BI, you only need to set up your corporate colors once. After that, all reports and slides match your corporate design automatically, and everyone in your organization can use them as the defaults. No hassle, no wasted time–because branding your presentations and sheets shouldn’t feel like an extra job on top of your job.
The think-cell competitor that allows you to work anywhere
To empower all users in your organization to create actionable reports (even if they're not BI ninjas), you need more than just a PowerPoint charting tool.
No matter whether you prefer to work online, on a desktop, or in Office apps, Zebra BI is an alternative to think-cell that will work anywhere. Pick any of the top 3 reporting platforms (Excel, PowerPoint, or Power BI) for Windows or Mac and create reports aligned with the latest best practices--all for a fraction of the think-cell cost.
No more excuses for rushed reports. Unlock real-time collaboration across teams and tools and empower your team to do their best work (ever).
Other solutions
PowerPoint

Excel

Power BI
Desktop (Windows & Mac)
Cloud (Office365)
Don't just take our word for it
“This tool is unique. Most tools only show us WHAT happened. Zebra BI answers WHY it happened.”

Gabriel Medina
Analyst at GxSoft Argentina
“Our controllers now spend less time preparing comprehensive reports and more time analyzing data and crystallizing the message.”

Alejandro Meyer
Planning & Controlling Director at SanLucar Fruit
“This a highly professional product. Our company’s leadership (finance and operations) is already asking we roll this out to all our PBI financial reports.”

Joe Pawlowski
Innovation Manager - Business Intelligence, DHL
action creates value
Zebra BI is much more than just another think-cell alternative

Built-in IBCS
Zebra BI visuals are IBCS-certified, leading to faster pattern recognition and interpretation of the reports.Regular updates
You want a tool that improves constantly so you can never fall behind with outdated reporting practices.

It works everywhere
Creating reports on desktop and sharing them in the cloud on Windows or Mac is possible with Zebra BI.
A few simple clicks
Saving time on creating complex visualizations leads to deeper insights analysis and better decisions.
No installation needed
Simply open your preferred platform and Zebra BI is already there without any installation packages.

Free version available
We believe in our products, use Zebra BI for free without any hidden costs until you’re ready to buy.
Widely accepted quality standards
4.9
user rating in Microsoft AppSource
Financial Times 1000
Zebra BI ranked among Europe’s Fastest Growing Companies
IBCS® Certified
With IBCS standards you make sure reports across your organization stay consistent and follow the same logic for easier understanding.
Learn more
PBI Certified
Zebra BI visuals for Power BI have been officially tested and certified by Microsoft ensuring they meet the highest data security standards.
Learn more
Create any bussiness report
carefully designed to match the latest reporting best practices
Start with a Free Template
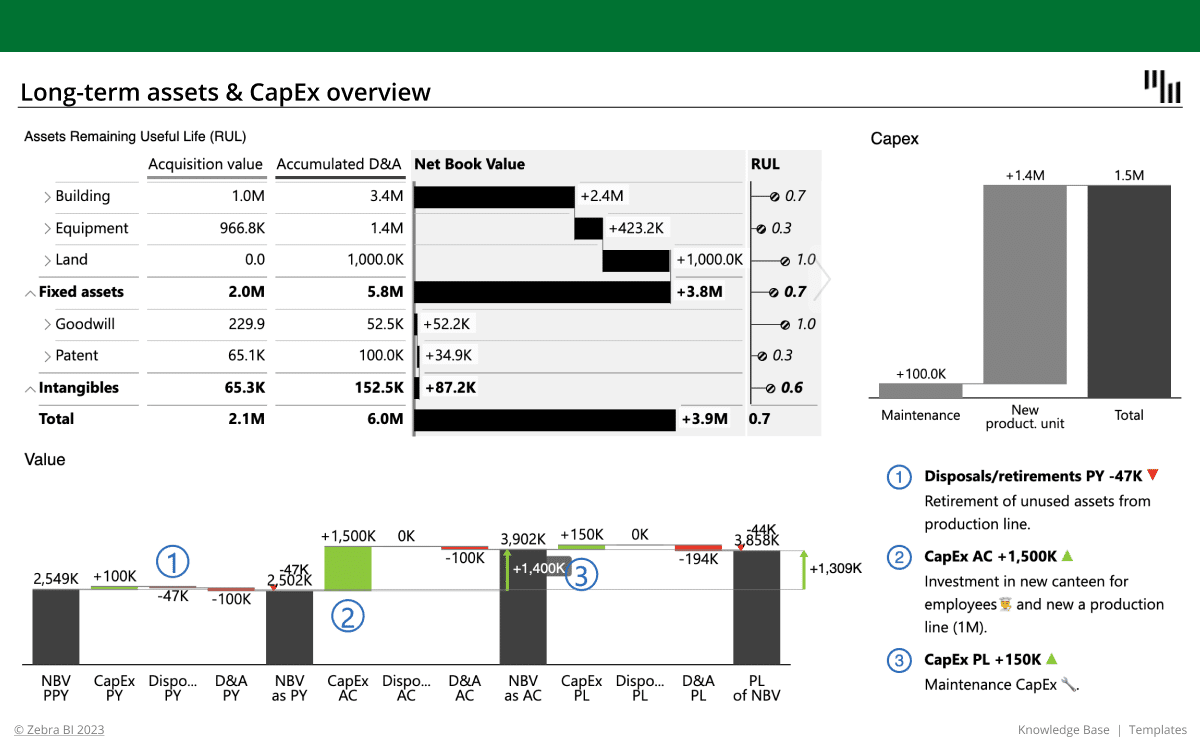
Long-term Assets and CapEx Report
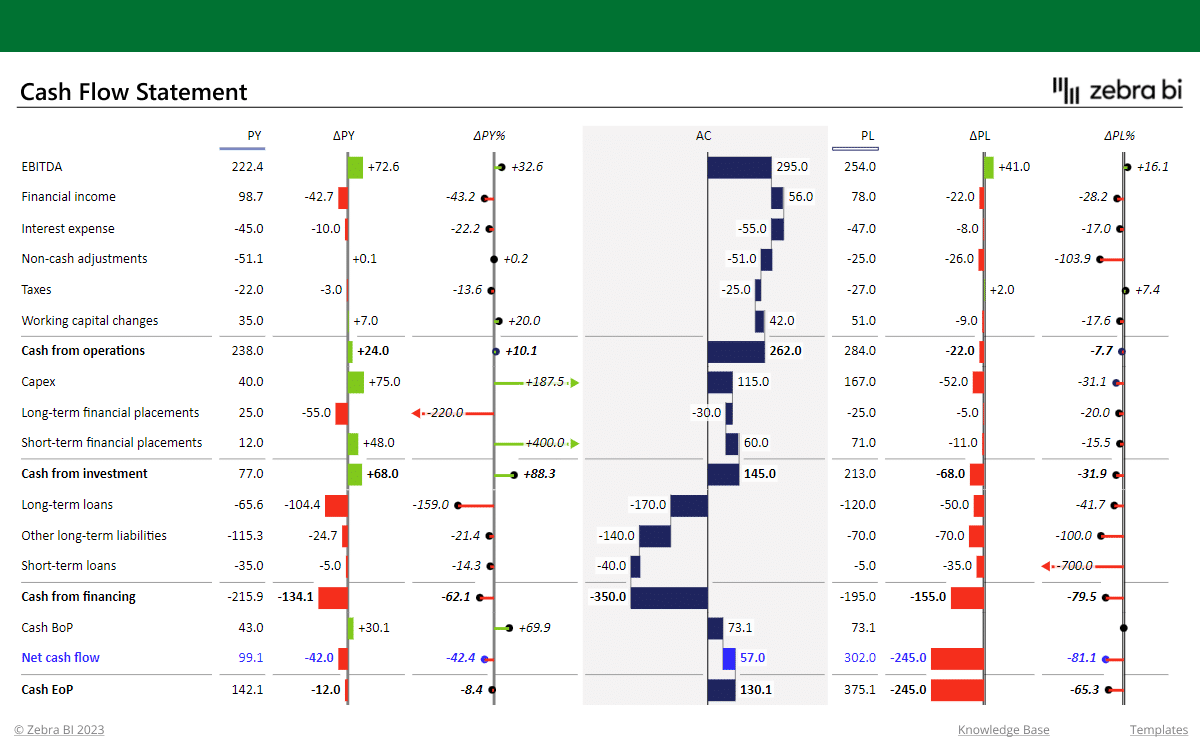
Cash Flow Statement form Pivot Table
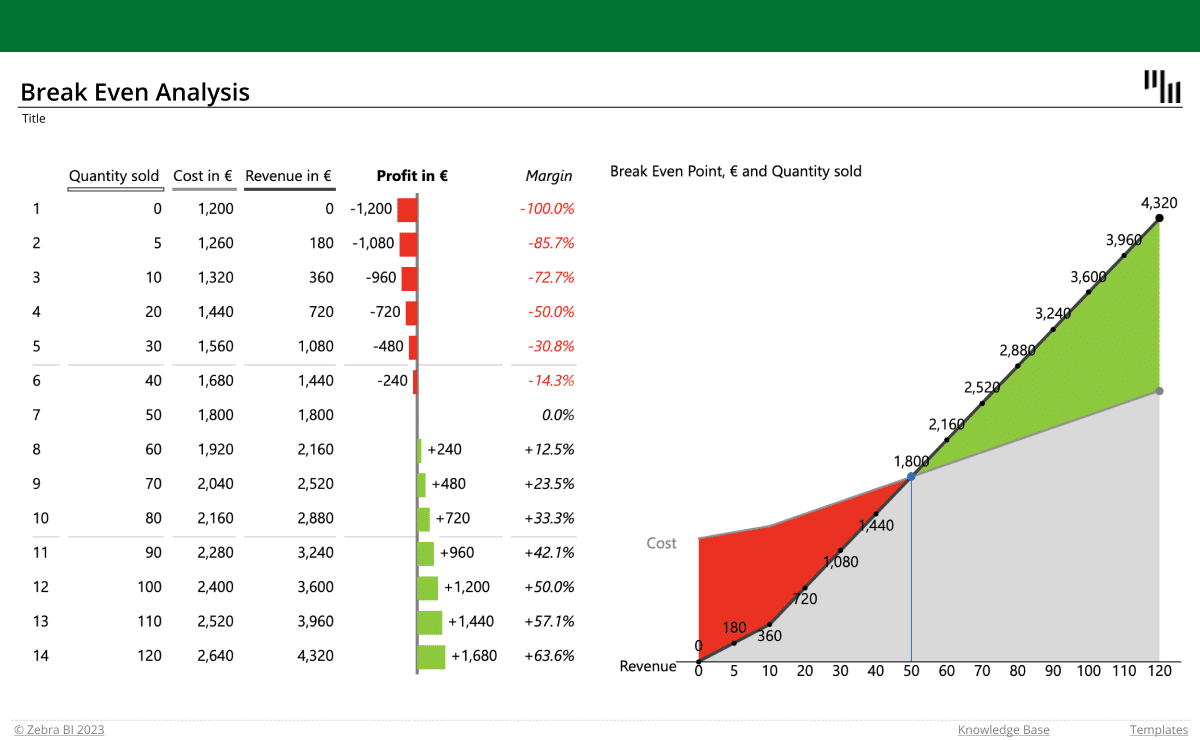
Break-Even Analysis Template for Excel
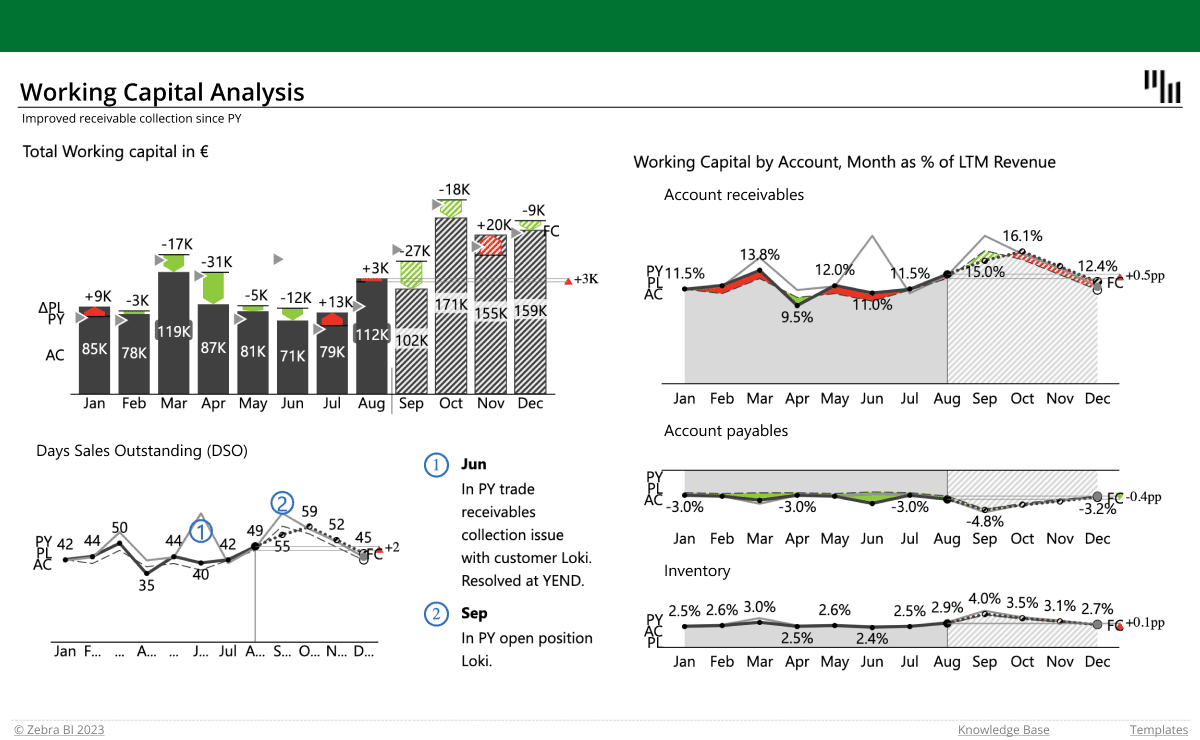
Working Capital Analysis
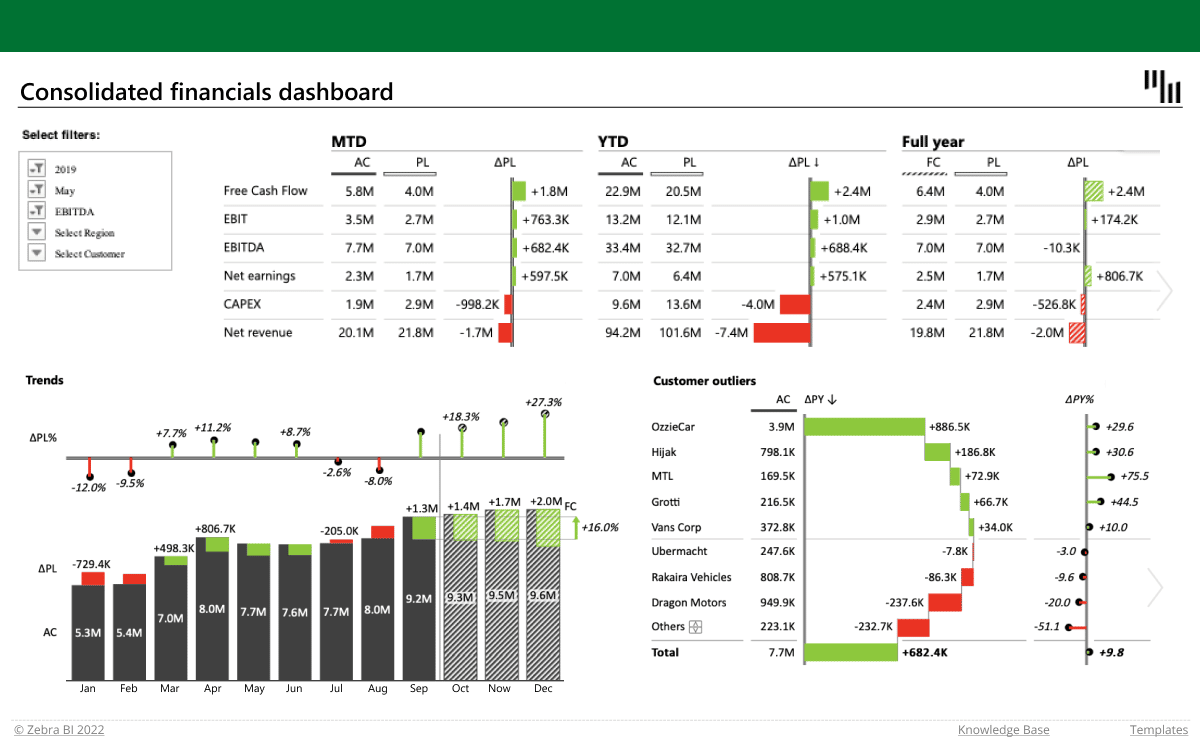
Consolidated financials dashboard in Excel
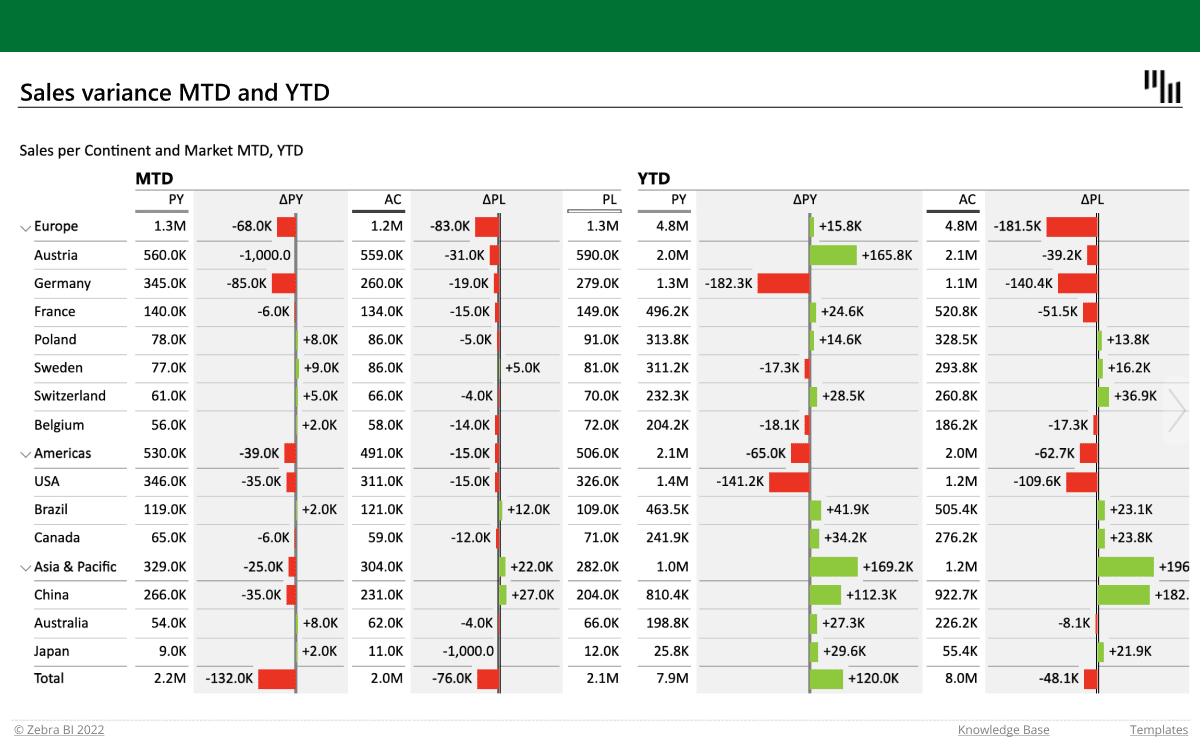
Sales variance report with multiple levels
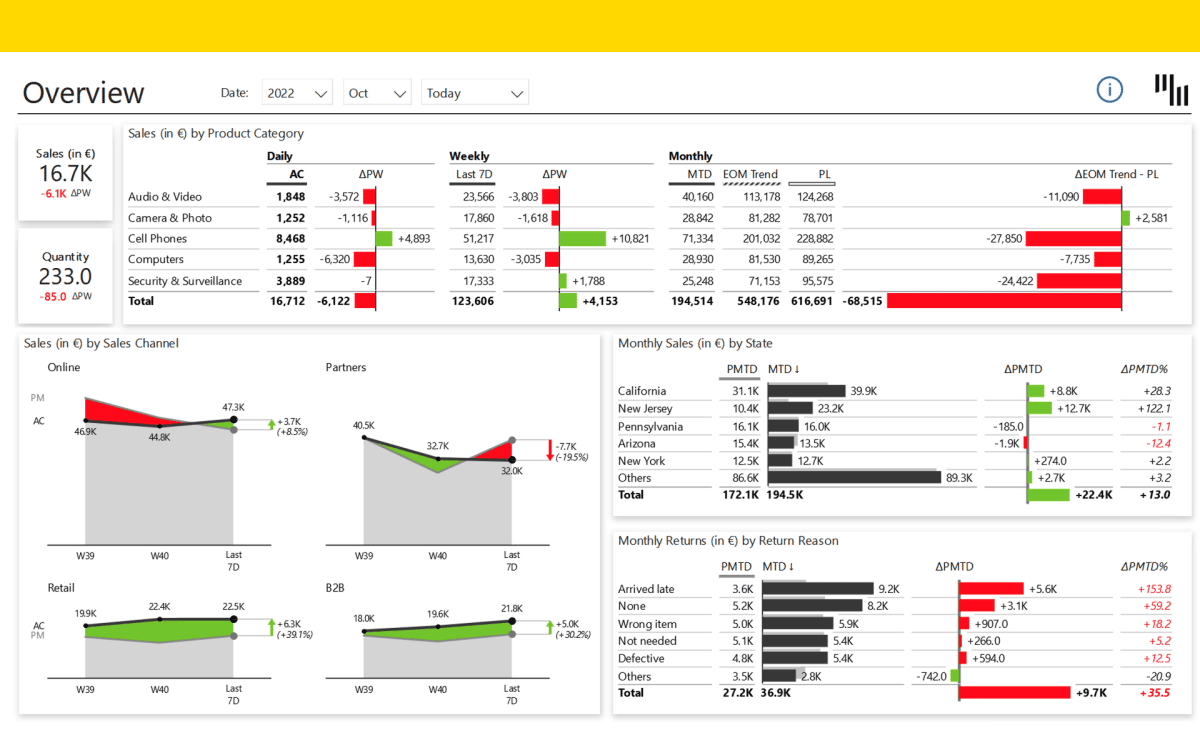
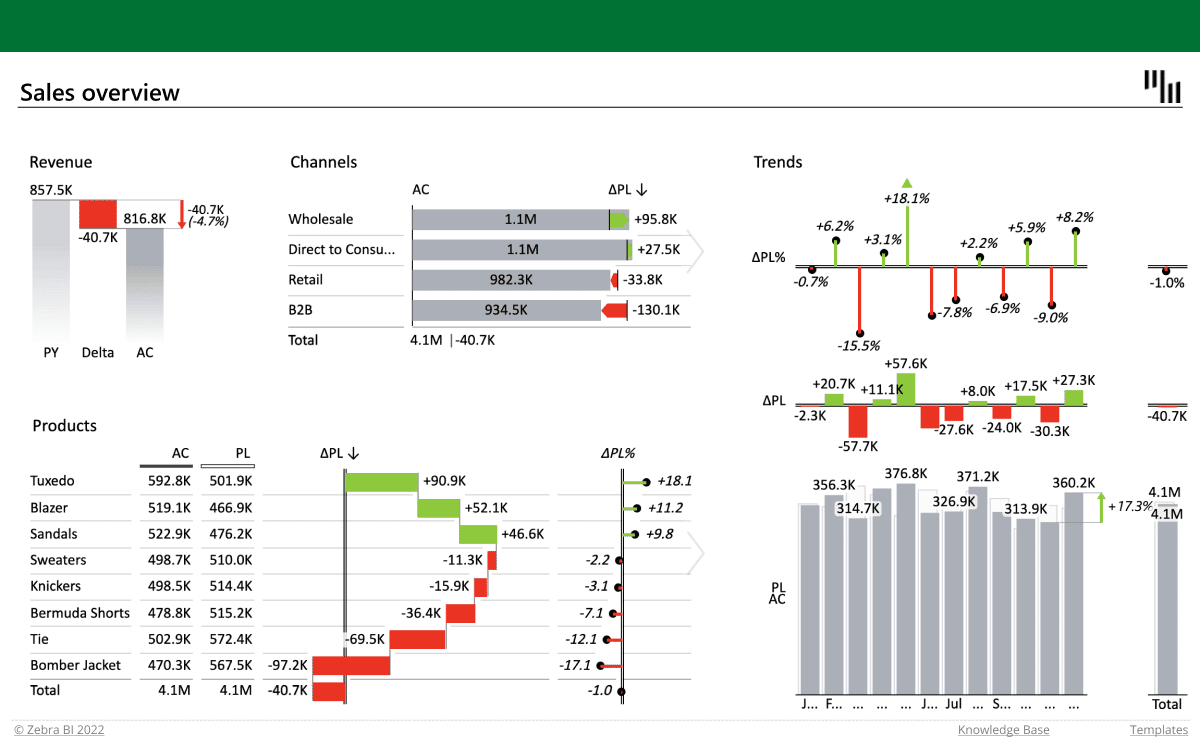
Sales overview report in Excel
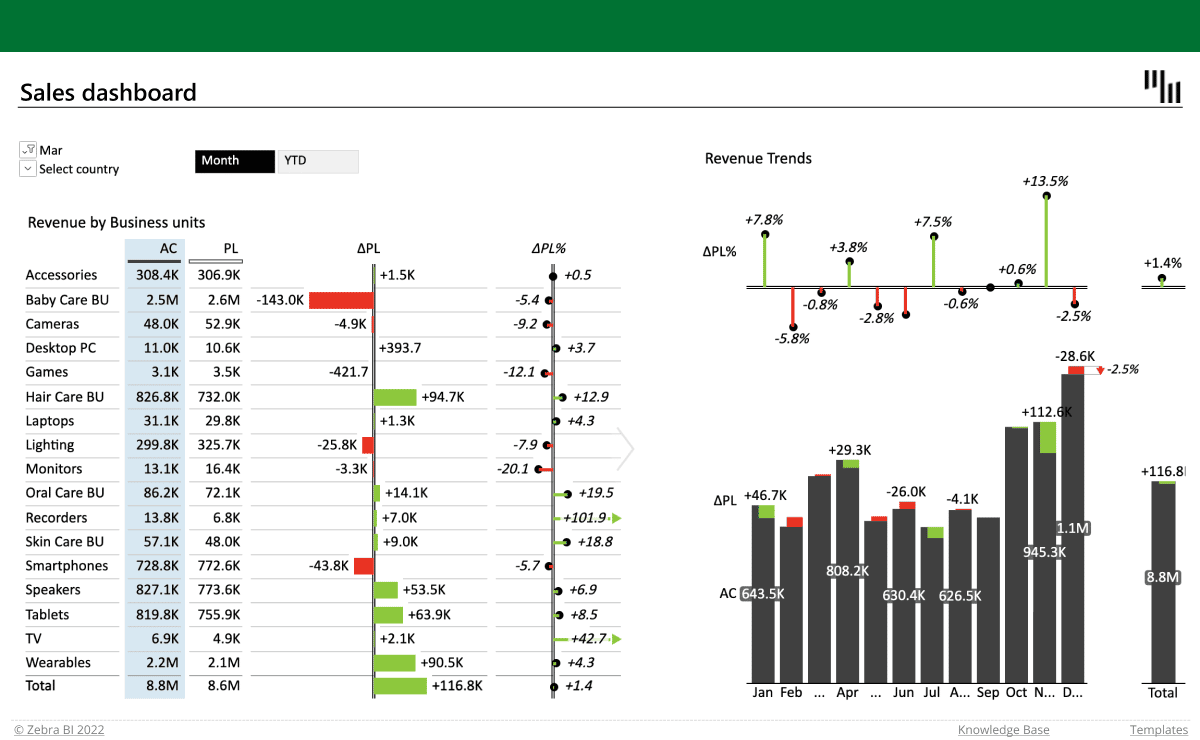
Sales Dashboard
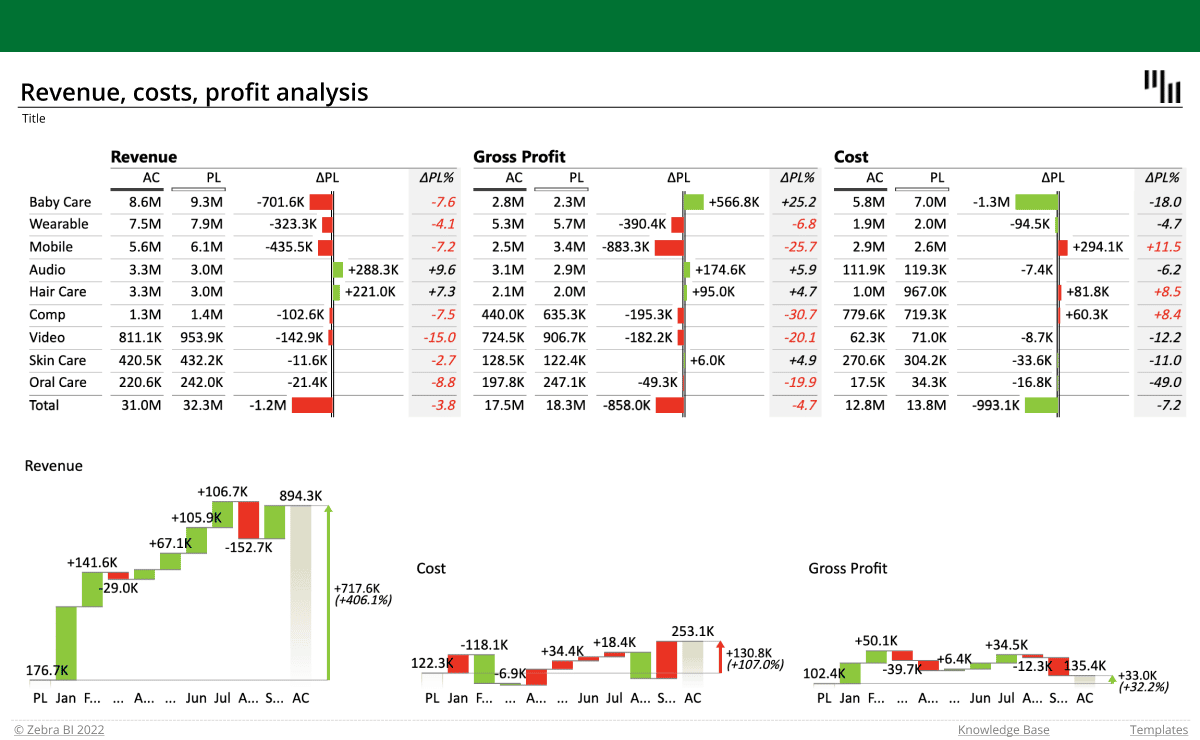
Revenue-cost-profit analysis
Inventory report
Quarterly income statement
Income statement with multiple levels
START FOR FREE
Ready to discover Zebra BI?
Get all the beloved think-cell features + more and join the Actionable Reporting wave with 3,000+ market leading companies.