Share this
Getting Started with Zebra BI for Excel


Watch this webinar and learn why Zebra BI is the perfect tool for effective visualization and standardization of your data.
You'll learn:
Presenter


Founder & CEO at Zebra BI
Andrej brings 25 years of experience in business intelligence and software development and 20 years as a consultant. Helping numerous international and regional companies achieve consistent and efficient internal reporting throughout the organization inspired him to build Zebra BI.
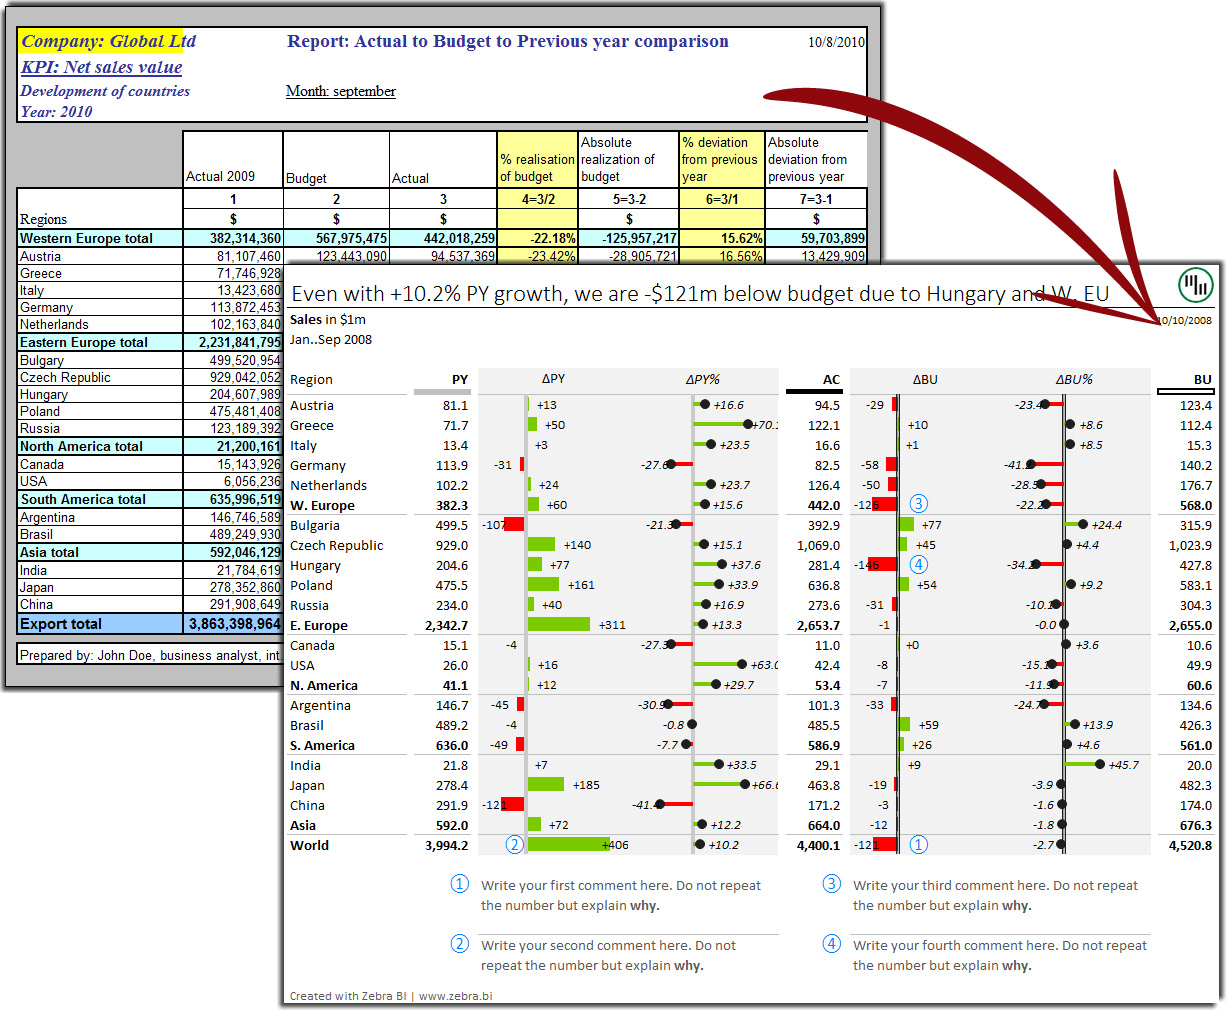
Need to clarify your data to better communicate your message? Zebra BI’s got you covered! 💪
Whether you’re a financial analyst or a business intelligence analyst, Zebra BI is the perfect Excel add-in to help you effectively visualize and standardize your data.
Not only does Zebra BI allow you to insert your data into standardized data visualizations for all to understand in just a few easy steps, but it also helps you add a level of professionalism to what you do. Watch the recording and see how Zebra BI takes the top 5 chart types for business analysts to the next level!