How to create board meeting PowerPoint slide decks like a consultant
An actionable board meeting PowerPoint slide deck is not one filled with lots of charts and colors.
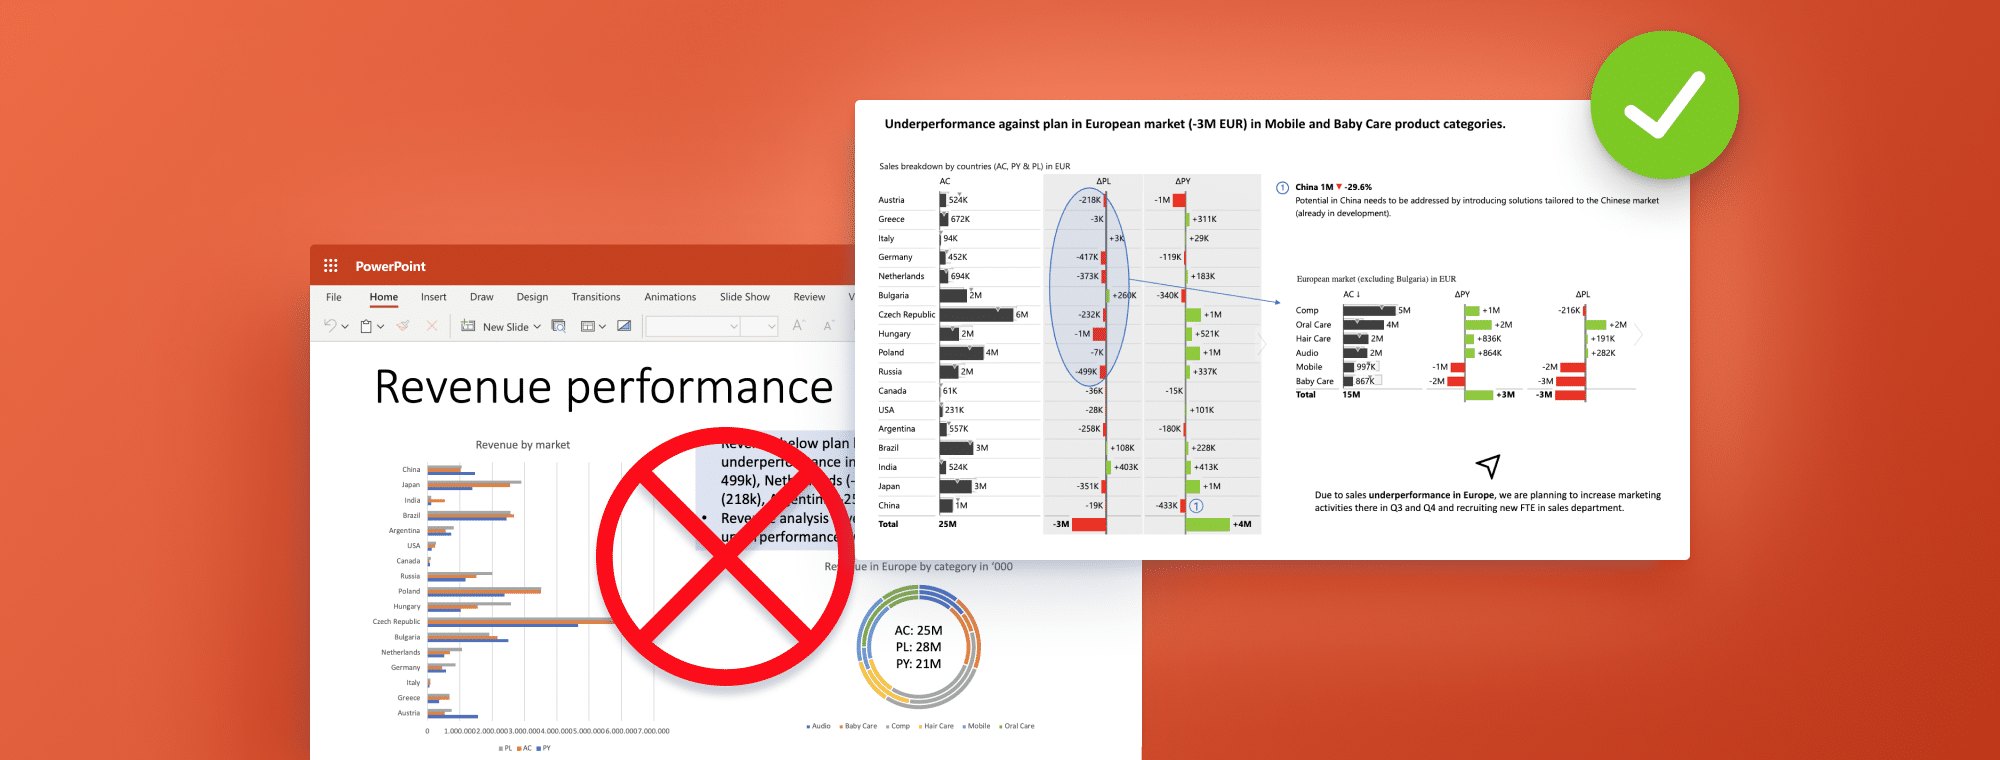
You shouldn't have to explain charts or tables in your slides to your viewers. Instead, the visualization should present the data to you immediately.
In our next webinar, you can discover the power of Zebra BI in PowerPoint to create professional-looking presentations in no time.
From IBCS compliance to advanced features like on-visual comments, waterfall (bridge) charts done with 1 click, and tables with integrated charts, you have the perfect tool to create presentations even the Big 4 companies would be jealous of.
Whether you're a consultant, FP&A analyst, controller, or data professional preparing regular presentations for management, you don't want to miss this one.
Wat je leert:
Presentator

Founder & CEO at Zebra BI
Andrej brings 25 years of experience in business intelligence and software development and 20 years as a consultant. Helping numerous international and regional companies achieve consistent and efficient internal reporting throughout the organization inspired him to build Zebra BI.
What are the key elements of PowerPoint financial reporting?
Despite all the modern tools and discussions about data storytelling, the internet is still filled with old-school PowerPoint slide design practices.
Your key message will not be well conveyed if you use meaningless colors, long tables with just numbers, and text comments all over.
Imagine preparing a slide deck in PowerPoint that is understood by everyone, from C-level managers to marketing, sales, and janitors. Even the most complex business reports like P&Ls can be visually appealing and show the right insights immediately.
With Zebra BI in PowerPoint, you can actually create such a slide deck in a matter of minutes. 😎
From waterfall charts and small multiples to advanced tables with integrated charts, on-visual comments & formula editor, seamless linking with Excel (and Power BI) to cover all aspects of reporting, easily applicable custom styles, and other advanced features you will for sure impress everyone looking at your slides. Besides that, you will see practical tips on how to use the slides' space effectively while maintaining a professional-looking board meeting PowerPoint slide decks.
Interactivity, flexibility, and a low learning curve are what you need to drive your business forward. See how to apply them to your presentations & reports with practical use cases.
Bekijk op aanvraag
Watch the video
Zebra BI-webinars zijn al bezocht door meer dan 10.000 deelnemers!