How to Design Income Statements (Profit & Loss Statements) in Excel
Join our webinar to learn how to redesign your income statements to make them:
- properly visualized using IBCS standards,
- easily understandable, and
- actionable.
Wat je leert:
Presentator


Founder & CEO at Zebra BI
Andrej brings 25 years of experience in business intelligence and software development and 20 years as a consultant. Helping numerous international and regional companies achieve consistent and efficient internal reporting throughout the organization inspired him to build Zebra BI.
Learn best practices for creating understandable income statements
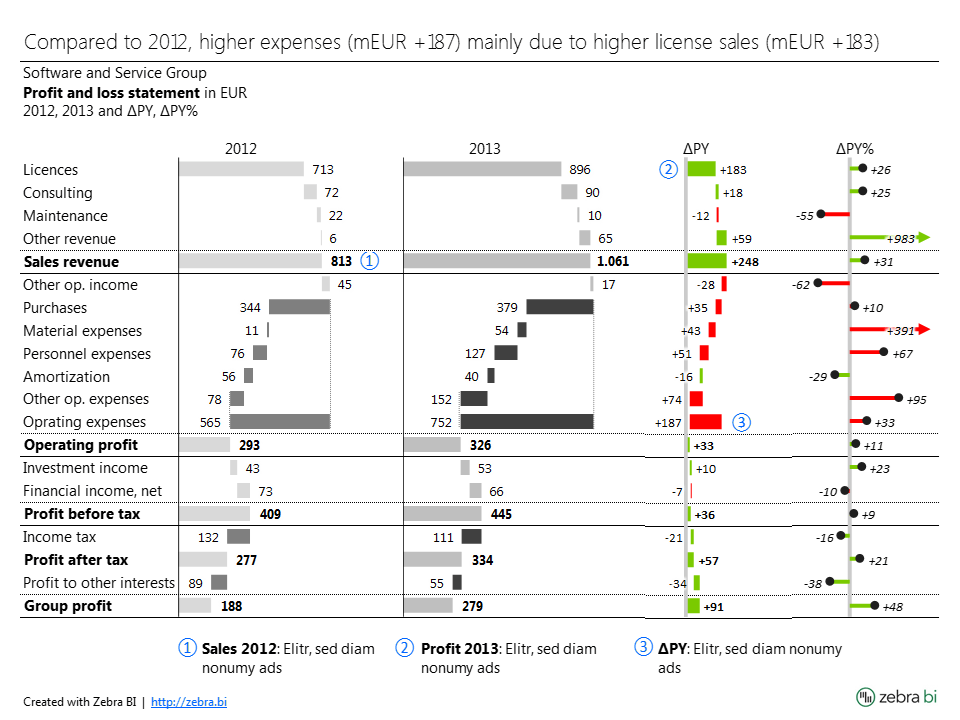
The Income Statement (or Profit & Loss Statement) is one of the four major financial statements used by FP&A professionals, accountants and business owners.
The biggest problem with most tabular income statements is that they are hard to read. It takes a lot of time to extract the most important insights from them.
Luckily, Andrej Lapajne, CEO and Founder of Zebra BI, will give you some guidance on how to redesign the income statements to make them actionable, understandable and in accordance with IBCS standards.
Bekijk op aanvraag
Watch the video
Zebra BI-webinars zijn al bezocht door meer dan 10.000 deelnemers!