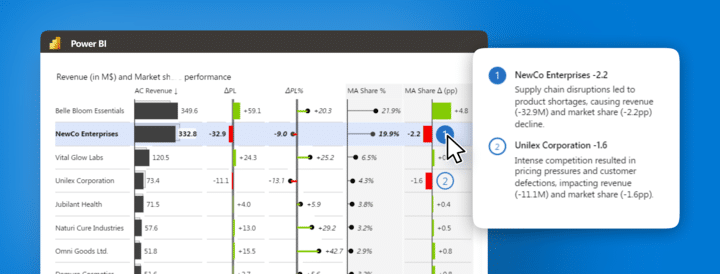


Nielsen's market reports are recognized for their relevance across multiple sectors, including consumer goods, retail, media, pharmaceuticals, automotive, food and beverage, technology and finance. But mastering Nielsen data in Power BI for brand analysis and strategic decision-making can be complex. This session will introduce the strategic approach to using Nielsen data. You will gain actionable insights and practical strategies to improve brand performance.
Join our webinar on mastering Brand and Product Portfolio Analysis in Power BI. In this session, you will:
Who is this for
This webinar is ideal for a diverse audience of business professionals:
If you're ready to drive brand success and make data-driven decisions, don't miss out on this webinar!
Nielsen's market reports help companies make informed decisions by providing insights into external market dynamics, consumer needs and the competitive landscape. Leveraging Nielsen data in Power BI is a valuable way for professionals across various industries to gain insights into brand performance, market share, sales, and other key metrics. However, effectively leveraging this data for brand analysis and decision-making can be complex without the right tools and methods. Fortunately with Zebra BI benchmarking against industry giants becomes seamless.
This session will provide you with the knowledge and tools you need to navigate market dynamics, competition, and performance benchmarks. With Brand and product portfolio analysis, you can systematically assess the strengths and weaknesses of each brand in your portfolio. Analyze all key aspects of your business environment, including market trends, market share, consumer behavior, competitive positioning, and financial performance.


