Share this
Supercharge your Power BI dashboards to drive action


Let's put an end to unintuitive reports with no simple way to get the right insights.
We invite you to watch this webinar to learn how to nail your dashboard landing pages in Power BI and make your KPI scorecards super actionable.
Bonus: don't miss the big reveal from Zebra BI either!
You'll learn:
Presenter


Founder & CEO at Zebra BI
Andrej brings 25 years of experience in business intelligence and software development and 20 years as a consultant. Helping numerous international and regional companies achieve consistent and efficient internal reporting throughout the organization inspired him to build Zebra BI.
Messy report landing pages should become a thing of the past
When you’re on the spot to make an important decision, every moment counts. You expect your report to provide you with immediate insights. But that’s not always the case.
Unintuitive reports with confusing layouts will prove just the opposite. You and your team might even lose focus while digging through them and put them aside. Also, doesn't it simply take too long between creating reports and making decisions?
That’s why so many companies around the world are already looking to Actionable Reporting to help them improve their dashboards and data storytelling. It’s time that messy report landing pages become a thing of the past.
Actionable Reporting happens when you implement reports that are well-structured, understandable, and actionable. Even more: they need to be appealing to use and easy to dig into.
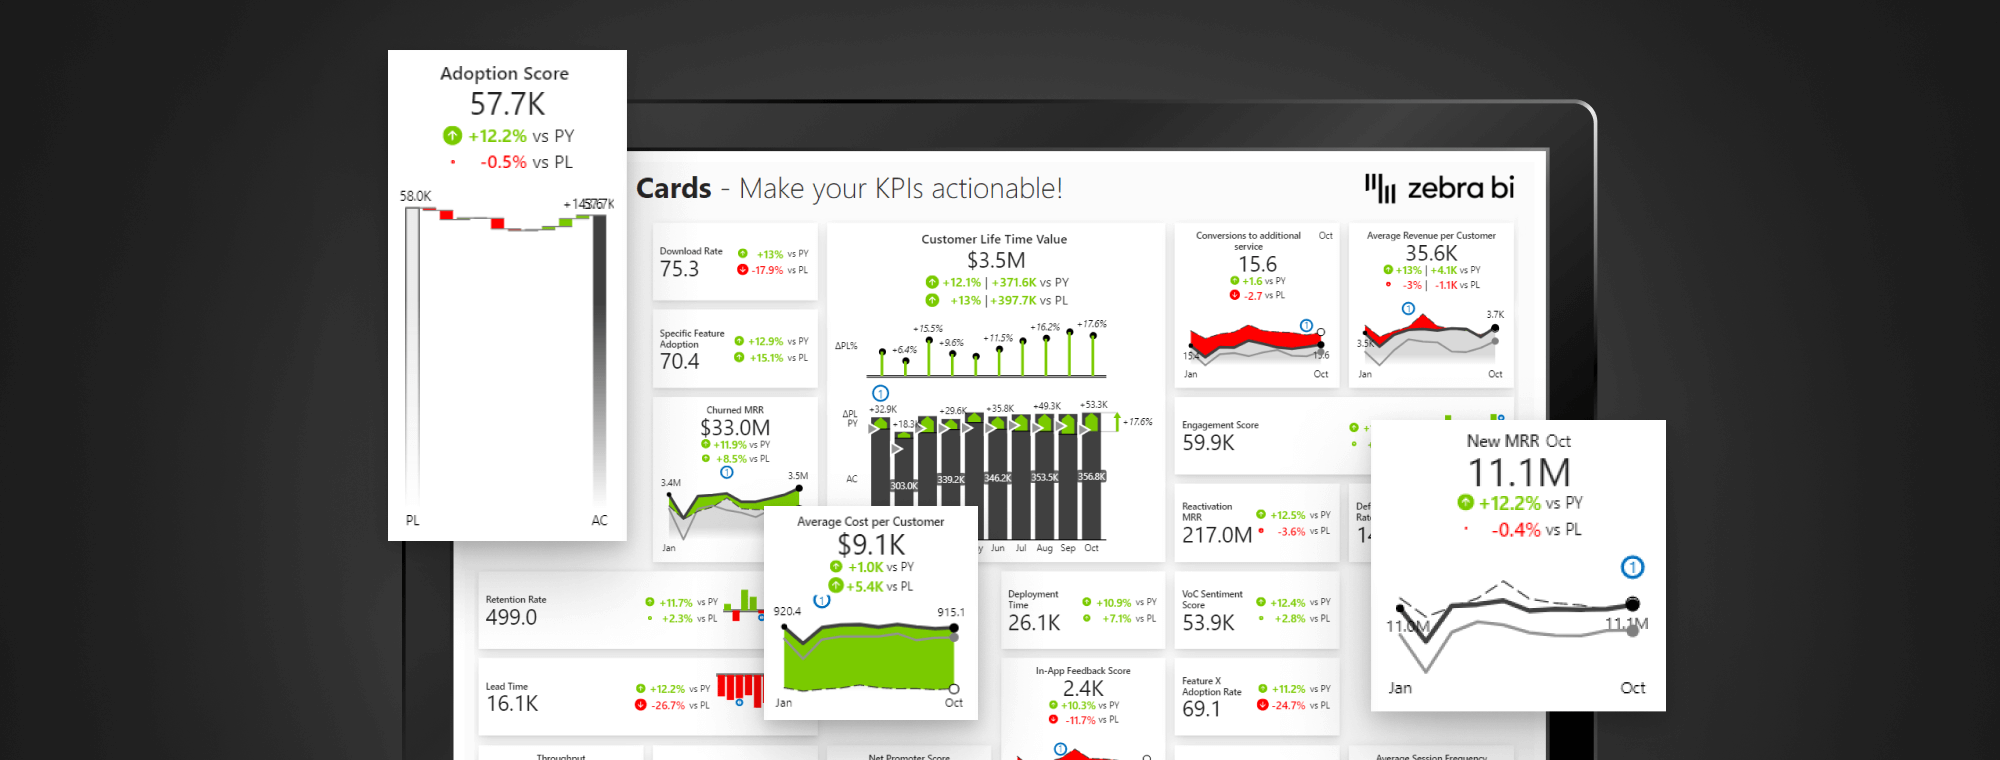
It all starts on your landing page with an informative scoreboard that tells you where your business is going.
This means you should be able to learn on the fly which KPIs are performing well and which are not. You should just glance at the landing page and see the comparison to plan, forecast, or previous year, see what is driving your KPIs up or down, and make predictions. And most importantly, you shouldn’t waste precious time.
The shift to Actionable Reporting has already happened and it will completely change the way you look at, understand, and visualize your data.