Zebra BI for Office 2.0 is now available!
Zebra BI for Office 2.0 is live!
👉 visual cross-filtering in Excel for the first time ever,
👉 automatic corporate branding,
👉 and seamless data linking between Excel and PowerPoint
are here to revolutionize your reports and presentations.
That's right - now you have everything you need for Actionable Reporting across your preferred platforms, be it Power BI, Excel, or PowerPoint.
Unlock a new level of flexibility and interactivity with your data today and don't be left behind.

Webinar DetailsGame-changing features for your Excel and PowerPoint
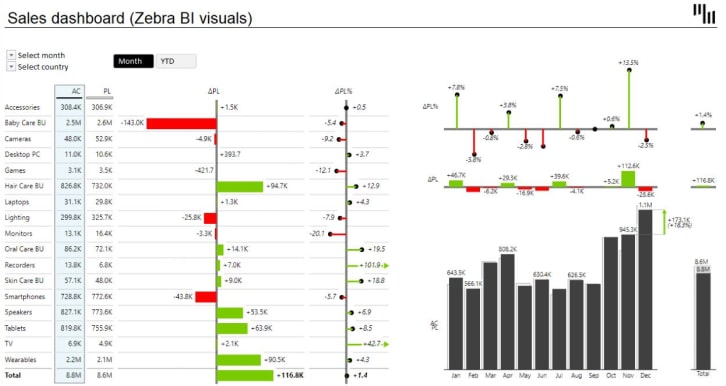
The three most wanted features for Excel and PowerPoint are here to elevate your reports and presentations to a completely new level.
With these added features, Actionable Reporting is available to everyone on any of their favorite platforms: Power BI, Excel, and PowerPoint.
With Zebra BI for Office 2.0 we're closing the gap as everyone can benefit from the highly interactive charts and tables no matter which platform you use. For the first time in Excel history, users can filter the data on their dashboards by clicking on the visuals directly. No more slicers and workarounds. It works automatically.
Furthermore, adapt your reports and presentations in Excel and PowerPoint to match your company branding. Apply it once and it will work automatically for everybody creating charts or tables in your domain. Just like magic.
And finally, for those who spend days juggling between Excel and PowerPoint, we're introducing the most seamless data-linking feature out there. It works on both platforms on the desktop and the cloud and reliable data is now only a few clicks away.
The future starts today.
You'll Learn:
Watch on-demand
Presenter


30+
Webinars
10k
Attendees
Infinite
Learnings
Join the conversation

Patrick Soehlke

Meena Laird

Rachel Guthrie
Wilco Nagtzaam

Kimberley Canoute

Raúl Vinuesa Arjona

Esteban Fabiani

Brahim Chabane
Ryan Cheung
Cheng Wang
Wilco Nagtzaam

Brian Julius

Jonathan Kapoor

Lars Schreiber

Pascal Kiefer

Harry Ferrera

Jeff "Power BI Lobbyist" Weir
Manuel Barahona Gandía

Daniel DeHaven

Tania Tombak


