Why BI fails in the Last Mile - How top teams turn reports into decisions

Part 1
Part 2
part 3

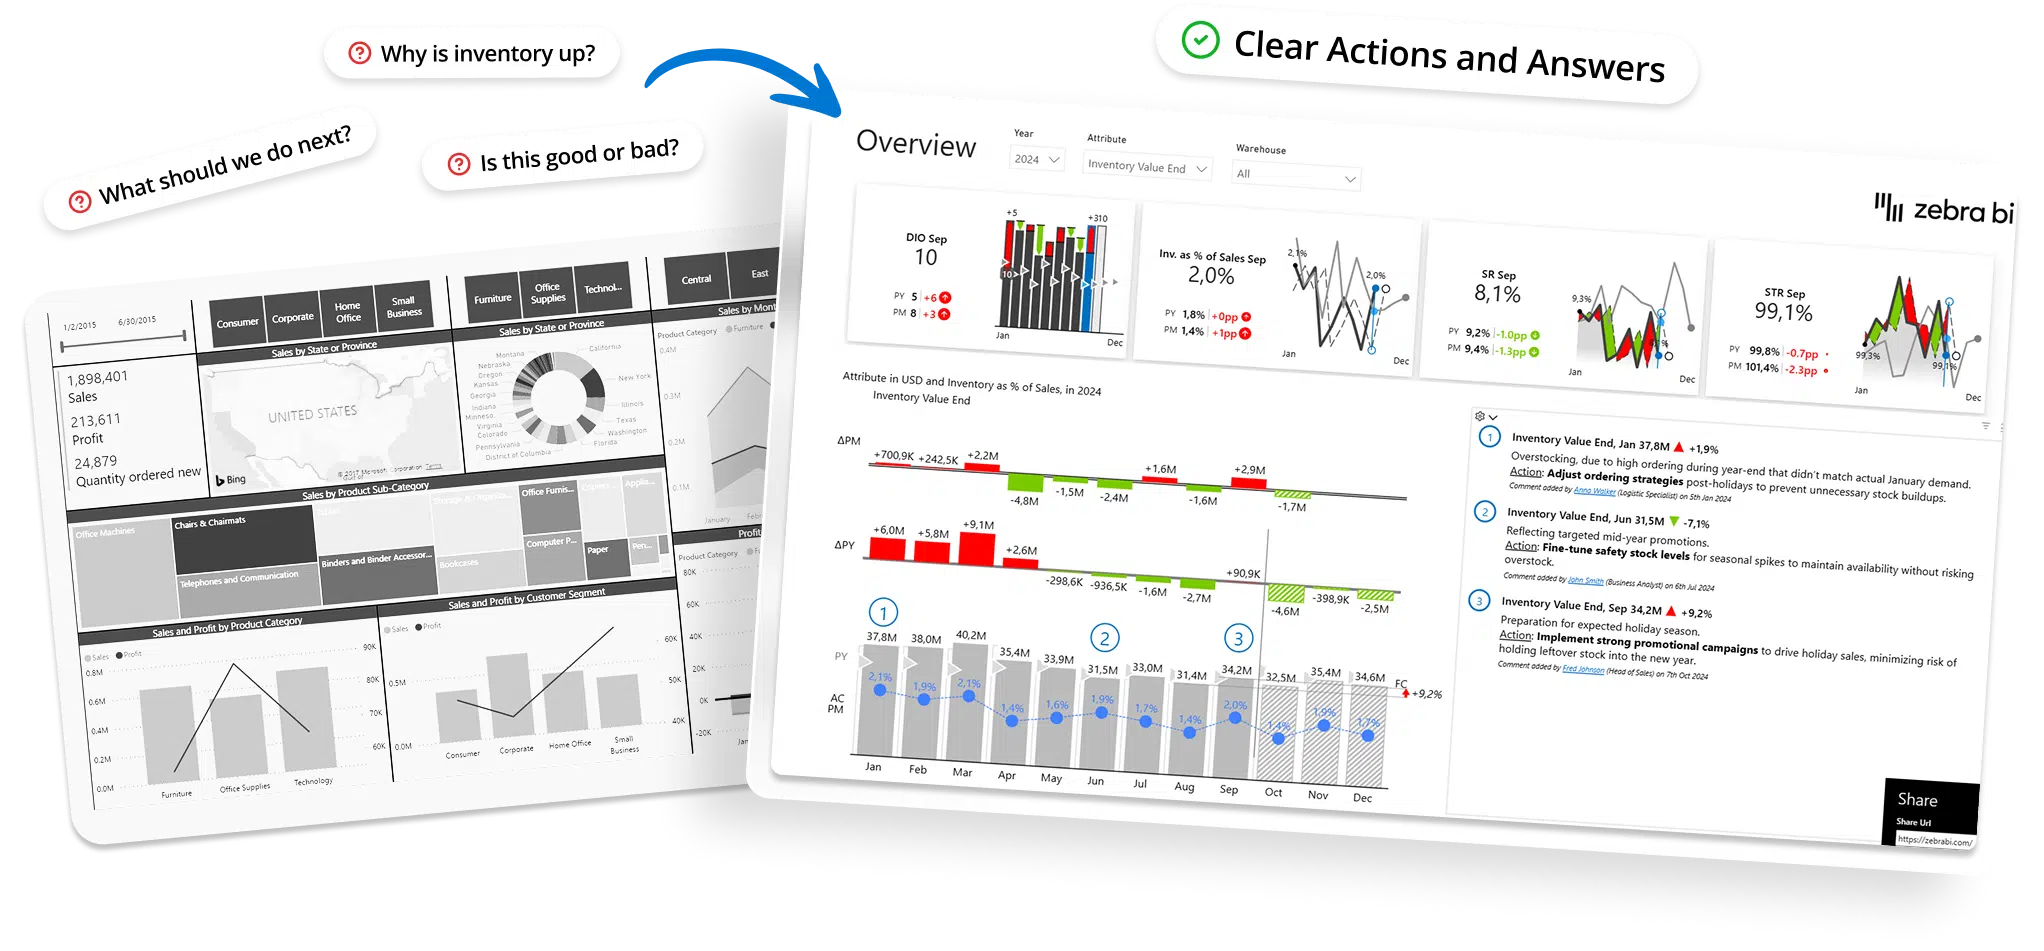
Can your BI answer: What's off plan? Why? What are we doing about it?

Your dashboards look great. Data is clean. Access is granted. So why aren't decisions happening?

In this live webinar, we show the real reason most BI initiatives fail, and why adding more dashboards, AI, or tools won’t fix it. 

You’ll learn how leading teams close the Last Mile of Analytics: the critical gap between insight and action where most value is lost. 

You’ll leave with a clear mental model you can apply immediately without changing your BI stack. 


You'll learn:
Why most BI value disappears after dashboards are published
What “Last Mile Analytics” really means — and why it’s now unavoidable
The structural gaps that prevent insight from turning into action
How top-performing organizations invest differently in analytics
What actually changes when reports become decision artifacts
Presenter

Andrej Lapajne

Founder, Zebra BI
Andrej brings 25 years of experience in business intelligence and software development and 20 years as a consultant. Helping numerous international and regional companies achieve consistent and efficient internal reporting throughout the organization inspired him to build Zebra BI.

Tine Ozimič

Head of BI at Zebra BI
Tine is the Head of Business Intelligence at Zebra BI with nearly 6 years of experience leading the BI team. He specializes in empowering organizations to transform complex data into actionable insights, working closely with BI specialists across all departments to implement strategic solutions that drive confident decision-making throughout the organization.

Register for the webinar

., . - . (.)
Register
Zebra BI webinars have been 
attended by 10,000+ visitors!

The problem no one talks about in BI

Most organizations don’t have a data problem. They have a decision problem. 

Despite massive investments in Power BI, data platforms, and analytics teams: 

  • Dashboards get built but Excel still runs the business 
  • Reports explain what happened but not what to do 
  • Insights exist but actions don’t follow 

Industry data is brutal: 

  • 70–80% of BI initiatives fail to meet their objectives 
  • Most dashboards are never used to make decisions 
  • The biggest blockers aren’t technical — they’re organizational 

The issue isn’t how analytics are built. It’s where they stop. That’s the Last Mile and it’s where BI breaks down. 

Who this webinar is for 

This session is designed for teams who already have BI  but aren’t seeing enough impact. 

It’s especially relevant if you’re: 

  • Finance Leader or Controller frustrated by reporting cycles and manual commentary 
  • BI or Analytics Leader tired of low adoption and constant change requests 
  • Senior Analyst whose insights don’t stick after meetings 
  • Power BI team under pressure to “drive more value” without more resources 

If your dashboards are polished but decisions still lag — this is for you. 

Part 1 of a 3-part series

Most teams stop after understanding the problem. 

This series takes you from problem to solution to proof. 

PART 1: Why BI fails in the Last Mile

📅 February 26, 2026 

Why BI stalls after dashboards go live and why this is systemic, not technical. 

Outcome: A shared language for the problem. 

PART 2: How teams cross the Last Mile

📅 March 26, 2026 

What decision-ready analytics looks like. Why standards like IBCS drive clarity, not aesthetics. 

Outcome: A practical model for action-driven analytics. 

PART 3: How teams actually did it

📅 April 23, 2026 

Real examples from teams who closed the gap. What changed in behavior, not just reports. 

Outcome: Confidence to apply this approach. 

Register for the full 3-part series 

Replays included. 

Save your spot 

Join us for this live session and learn why fixing BI isn’t about building more dashboards it’s about finishing the journey from insight to action. 

Register now. Start closing the Last Mile of Analytics. 

.

., . - . (.)
.
Share this

Register for the webinar

., . - . (.)
Register
Zebra BI webinars have been 
attended by 10,000+ visitors!

Join the conversation

What a great audience, so much knowledge in one place.
Patrick Soehlke
Managing Director at Next Vision GmbH
Watching Zebra BI videos was a game changer for me in dashboard and report design! Thank you for always having great content! ⭐️
Meena Laird
Data Analyst
Woohoo! You guys rock the data viz world - keep up the great work!
Rachel Guthrie
Customer Success at Microsoft
Our financial landing page at KPN is completely based on the sales dashboard template. We also use a copy of the consolidated financials. The templates of Zebra BI are providing us with a lot of inspiration, and we don't "need to invent the wheel" again 😉
Wilco Nagtzaam
Senior FP&A Controller
You guys are amazing! Thanks so much for the great content! Keep up the fantastic work 👍
Kimberley Canoute
Business Intelligence Analyst
An amazing visual for finance. It has a lot of possibilities such as analytic periods, variances, or custom hierarchies for your income statement. 100% advisable.
Raúl Vinuesa Arjona
Senior Data Consultant
Awesome reports. Lots of tricks inside, thanks to the Power BI and the Zebra BI visuals.
Esteban Fabiani
MS PowerBI Consultant
Zebra BI is the best feature that has been created for Power BI. It makes designing reports easy. Thank you.
Brahim Chabane
Zebra BI User
I spent a couple of hours searching for a solution, your brief tutorial was the only one that worked for me. Thanks so much!
Ryan Cheung
Zebra BI User
It looks so good to a point that makes me be like, what's the point of me learning given I'll never be that good.....😄
Cheng Wang
Zebra BI User
Amazing, Mindblowing, Supereasy
Wilco Nagtzaam
Senior FP&A Controller
I've recently been experimenting with Zebra BI's custom Table visual, which is like the native Power BI matrix on steroids. If your work allows for the use of custom visuals, I think it's definitely worth checking out. Planning on doing a video on it soon...
Brian Julius
Chief Content Officer at Enterprise DNA Ltd.
Hot damn @ZebraBI...speechless. Can’t share it but it looks good!
Jonathan Kapoor
Commercial Reporting and Insights Manager
Hey @ZebraBI: Your CEO is a cool dude and your visuals for #powerbi and #Excel are insane. Thanks @lapajne for presenting today. It was a ton of fun 👊
Lars Schreiber
Power BI Consultant & Trainer
I can't believe you always manage to pack so many new and great features into every update :-)
Pascal Kiefer
CEO & BI Consultant
I dare to say that Zebra BI is the most realy hight level custom visual that exist right now. Amazin job, great updates. I definitely will keep recomending this custom visual to our clients.
Harry Ferrera
Senior Business Intelligence (BI) Analyst
I had a phone interview for a #PowerBI contract, where the interviewer said of the sample dashboards in my CV: "Great...I see you use @ZebraBI!" How cool is that? And they mentioned my top-secret passphrase on the call: "Actionable Insight". I'm in.
Jeff "Power BI Lobbyist" Weir
Modelling/Visualisation consultant and analytical storyteller
The reusable trick of switch I think is brilliant! And obviously, Zebra BI table replaces any other table now in Power bi. RIP to normal tables!
Manuel Barahona Gandía
Business Intelligence Reporting Manager
This visual from Zebra BI enables you to build stunning P&L, CF, and BS statements with complex structures with ease. Very intuitive for developers and users. In my opinion the best solution for Financial Reporting structures. 11 Stars!
Daniel DeHaven
Director of Financial Systems
Already tried stacked bar. It's fantastic! Thank you for such a great feature!
Tania Tombak
Principal Consultant, Executive Dashboards and Data Analysis
As you say, Andrej Lapajne, we spent A LOT, searching and explaining how to do Comments, with Power Apps, and also with the help of Excel. They were workarounds!!! No doubt...this is awesome and the simple way to go forward.
Esteban Fabiani
MS PowerBI Consultant
Practical dashboards. Real decisions.
Save Your Seat