Zebra BI closes the gap between data and the decisions your
leadership needs to make across Power BI, Excel, PowerPoint, and AI.


Made for FabCon Atlanta · Microsoft Fabric Community Conference
Your organization has data.
It doesn't have answers yet.
+ 46%
increase in speed of analysis*
2 FTEs
saved per year
+61%
improvement in decision accuracy*
4.8
user rating
Zebra BI is trusted by:








You have more data than ever.
Fewer clear answers than you need.
THE PROBLEM
Power BI, Fabric, data warehouses, analytics teams: the infrastructure is there. But
Leadership still leaves meetings without decisions, or waits for a follow-up report
that should have been in the room.
Leadership still leaves meetings without decisions, or waits for a follow-up report
that should have been in the room.

Without Zebra BI = what leadership sees today
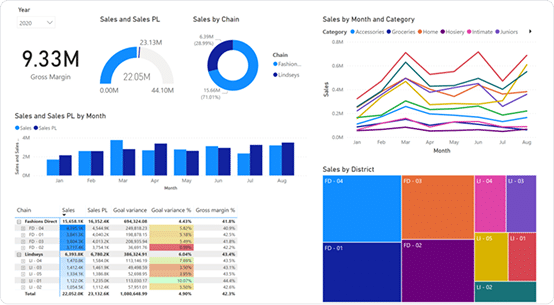
Inefficient chart types, inconsistent colors, no variance vs plan. Leadership needs a walkthrough before they can act.
Every single time.
Every single time.
Data debate
Needs explaining
Follow-up required

With Zebra BI = what leadership will see
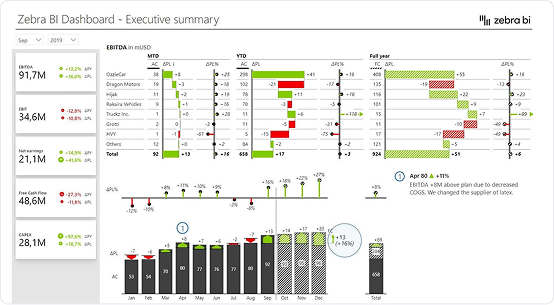
Key drivers, variance vs plan, trends, context = all visible at a glance. Leadership sees key information immediately, so the meeting starts with a decision, not just data.
Instant clarity
Clear context
Decision in the room

Inefficient meetings are a cost
nobody measures
You sit in a meeting, debate the numbers only for everyone to agree to come up with another report next week. That's not decision-making you should make to stay ahead of the competition.

Reports need explaining before they can be used
When every dashboard requires a
walkthrough, the organization moves one step slower in every cycle, and the data team becomes a bottleneck, not an
asset.
walkthrough, the organization moves one step slower in every cycle, and the data team becomes a bottleneck, not an
asset.

No unified view at the executive level
In Finance, blue means something good. In Sales, blue means something bad. Executives spend to much time decoding reports. It leads to lack of trust in the reporting infrastructure from the top.
THE SOLUTION
Zebra BI on top of the Microsoft stack.
The layer that closes the gap.
You've already invested in the Microsoft stack: Power BI, Excel, PowerPoint, Fabric.
Zebra BI doesn't replace any of it. It adds the professional reporting standard that Microsoft leaves to specialists: the layer that turns your data into
decisions leadership can act on immediately.
Zebra BI doesn't replace any of it. It adds the professional reporting standard that Microsoft leaves to specialists: the layer that turns your data into
decisions leadership can act on immediately.
Works across your full Microsoft stack


Certified Visuals
• Works inside your existing Power BI, Excel, PowerPoint, or Fabric

Decisions made in the room, not after it
IBCS-standard visuals show variance, trend, and context in one glance no walkthrough needed. Management reviews end with a decision, not a follow-up action item for the analytics team.

One version of truth across every department
IBCS enforces a single visual language across Finance, Sales, Marketing, and Operations built into the tool. Everyone reads every report the same way.

Risks surface before they
become crises
Automatic variances highlight outliers in the report so they are not missed during the decision-making. The organisations that respond fastest are those whose data communicates clearly by default.
Customer Evidence
Measured outcomes from organisations like yours
1/2 day
for a full report
3x
faster report creation
100+
self-service dashboards for business users
1 analyst
covering 6 departments at once
"Our CFO stopped using other tools and now lives in the Zebra BI dashboard for meetings. It's easy to use, and the value was immediately clear."
— W.L. Gore Medical Products
"Management feedback was exceptional after switching from PowerPoint to Zebra BI-powered dashboards. Leadership stopped asking for follow-up reports."
— Raiffeisen Bank International
"Zebra AI has been a true game changer for us. Critical analytical processes that once consumed significant time and resources
are now completed in a fraction of the time.."
are now completed in a fraction of the time.."
— Zurich Insurance, Group Re
Microsoft + Zebra BI
Two tools, built to complete each other
Zebra BI doesn't compete with Microsoft: it completes the investment.
Power BI, Excel, and PowerPoint were built for broad analytical use cases across every industry. Zebra BI adds the professional reporting standards that turn business data into decisions.
Power BI, Excel, and PowerPoint were built for broad analytical use cases across every industry. Zebra BI adds the professional reporting standards that turn business data into decisions.
The framing that lands: Power BI gives you the platform. Zebra BI gives you the standard, so your story finally reaches the boardroom.
Microsoft Power BI
Power BI + Zebra BI
Built for
Broad analytical use cases: self-service BI across all teams and industries
Professional business reporting and executive-grade decision communication
Financial charts (P&L, waterfall, variance)
Require significant custom
work to match finance standards
work to match finance standards
✓ No custom DAX or design work, IBCS-compliant by default
Org-wide visual standard
Enforced through internal guidelines
✓ Built into the tool, consistency is the default, not the exception
Executive report adoption
Depends on design quality of each
individual report
individual report
✓ W.L. Gore and Heijmans CFOs stopped using other tools for Zebra BI
THE AI ENGINE
Zebra AI turns business data into
decision-ready stories
Zebra BI helps leadership read the story instantly in Power BI, Excel, or PowerPoint. Zebra AI helps teams build, explore, and defend that story. Together, they reduce reporting friction and increase decision velocity.

Start with key drivers
Zebra AI automatically creates the initial story for you by assembling the first dashboard, surfacing the key movements, and highlighting the likely drivers.

Let chat handle the follow-up
When the room asks 'why, what next, or what if', Zebra AI’s chat helps teams drill down by segment, region, product, or period, test scenarios, explore forecasts, and extend the analysis.

Act on insights easily
Share decision-ready stories across the business via link or export to PowerPoint and Excel, so stakeholders can review, align, and act faster.
THE Outcome
How to have the conversation with your boss
The business case in the language that lands at the executive level

What it reduces

Reporting time: 2–4h per person, per month
Less formatting, more analysis and business partnering.
Meeting overhead: fewer follow-ups, shorter reviews
When the answer is in the report, reviews stop generating action items after the fact.
Maintenance cost: one standard, little DAX
Standardize many messy reports into a few clean ones, saving hundreds of engineering hours.

What it IMPROVES

Faster decisions: answered in the meeting, not after
Pricing, headcount, and strategy calls happen in the time available, not next cycle.
Earlier risk signals: problems visible before they escalate
Automatic variance highlights surface outliers in the report, not in the post-mortem.
Org-wide clarity: one standard, every team, every report
Starts in Finance, scales to Sales, Marketing, and Operations.
What to say in the meeting
"We're already using Microsoft platforms. Zebra BI doesn't replace them; it adds the reporting standard we're missing. Leadership gets clearer answers, we spend less time on formatting, and it works inside the tools we already have. Implementation is days, not months. ROI shows up in the first close cycle."
Book a 15-minute call with our experts
Pick a time that works for you. We'll show you exactly what this looks like with your data not a generic walkthrough.