


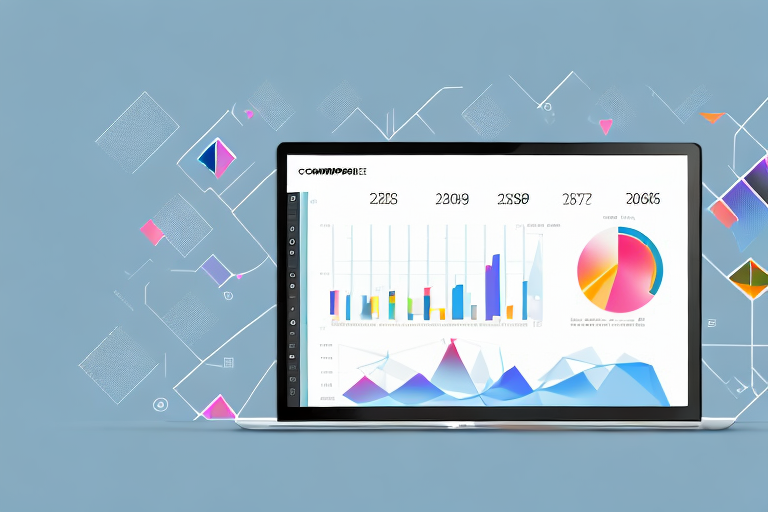
Power BI is a powerful data visualization tool used by businesses and organizations to turn raw data into actionable insights. The tool offers a range of visualization options including charts, tables, and graphs. However, what really sets Power BI apart from other visualization tools is its ability to link visuals. Linking visuals allows users to create interactive dashboards that can provide deeper insights into their data. In this article, we will explore everything you need to know about linking visuals in Power BI so you can take your data visualization to the next level.
Table of Contents
Introduction to Power BI and Visuals
Power BI is a business analytics tool developed by Microsoft that can be used for data modeling, analysis, and visualization. One of the key features of Power BI is its ability to create and customize visuals. Visualizations help users to see patterns and trends in their data quickly and easily. In addition, visuals can be easily shared with others across an organization.
Another advantage of using Power BI visuals is that they can be interactive. Users can interact with the visuals by selecting data points, filtering data, and drilling down into specific details. This allows for a more dynamic and engaging way of exploring data, and can lead to deeper insights and understanding.
Understanding the Importance of Visuals in Power BI
Visuals are essential in Power BI because they help to quickly communicate complex information in a way that is easy to understand. With visuals, users can quickly identify trends, patterns, and outliers in their data. Visuals also enhance the user experience by making it easy to consume large amounts of information at once. All of this makes it more likely that insights will be uncovered and acted upon.
Moreover, visuals in Power BI can be customized to fit the specific needs of the user. This means that users can choose the type of visual that best represents their data, whether it be a bar chart, line graph, or scatter plot. Additionally, users can customize the colors, labels, and formatting of their visuals to make them more visually appealing and easier to understand. By taking advantage of these customization options, users can create visuals that are not only informative but also aesthetically pleasing.
How to Create Visuals in Power BI
Creating visuals in Power BI is relatively easy. Users can choose from a wide range of visualization options including charts, tables, and graphs. To create a visual, simply select the data that you want to visualize and drag it onto the canvas. Once the data is on the canvas, users can customize the visual by choosing the type of visual, changing colors, and adding titles and labels.
One important thing to keep in mind when creating visuals in Power BI is to ensure that the data being used is accurate and up-to-date. Power BI offers a variety of data refresh options, including manual and automatic refresh, to ensure that the data being used in the visuals is always current. Additionally, users can set up alerts to notify them when data changes or when certain thresholds are met, allowing for timely and informed decision-making.
Tips for Creating Effective Visuals in Power BI
Creating effective visuals can be a little more complicated than simply creating a visual. To create effective visuals, it is important to keep the target audience in mind. Some tips for creating effective visuals include:
- Keep it simple and avoid clutter
- Choose the right type of visual for the data being presented
- Use color strategically and avoid using too many colors
- Make sure visuals are consistent and easy to compare
Another important tip for creating effective visuals in Power BI is to use appropriate labels and titles. This helps the audience understand the data being presented and the context in which it is being presented. Additionally, it is important to use appropriate fonts and font sizes to ensure that the visuals are easy to read and understand.
Finally, it is important to test and iterate on your visuals. This means getting feedback from your target audience and making adjustments as needed. By testing and iterating, you can ensure that your visuals are effective and impactful in communicating your message.
Why Linking Visuals is Important in Power BI
Linking visuals is important in Power BI because it allows users to create interactive dashboards. By linking visuals, users can select specific data points to drill down into and get more information. This allows users to quickly identify relationships and patterns in their data that they may have otherwise missed.
Another reason why linking visuals is important in Power BI is that it helps users to save time. Instead of having to navigate through multiple pages or reports to find the information they need, users can simply click on a data point in a visual and be taken directly to the relevant information. This can be especially useful for users who need to quickly make decisions based on their data.
Furthermore, linking visuals in Power BI can help to improve collaboration among team members. By creating interactive dashboards with linked visuals, team members can easily share insights and collaborate on data analysis. This can lead to more informed decision-making and better outcomes for the organization as a whole.
Understanding the Different Ways of Linking Visuals in Power BI
There are a few different ways to link visuals in Power BI. One way is to use the same data source for multiple visuals. This allows the visuals to be linked and synced. Another way is to use bookmarks to link different pages or visuals in a report. This allows users to click on a specific bookmark and be taken to the linked visual or page.
Additionally, another way to link visuals in Power BI is to use drillthrough. This allows users to click on a specific data point in a visual and be taken to a more detailed report or visual that focuses on that specific data point. Drillthrough can be set up by creating a separate page or visual that is linked to the original visual, and then setting up the drillthrough action to be triggered by clicking on the desired data point.
Step-by-Step Guide to Linking Visuals in Power BI
To link visuals in Power BI, follow these steps:
- Ensure that the visuals you want to link are using the same data fields.
- Select the visual that will act as the source for the interaction.
- Go to the ‘Visualizations’ pane and find the ‘Edit interactions’ option.
- Use the ‘Edit interactions’ feature to specify how other visuals on the report page will react when you select elements within the source visual.
- Repeat the process for other visuals you want to link, setting the interactions as desired.
- Test the interactions by selecting data points in your source visual and observing how other visuals respond.
Linking visuals in Power BI can be a powerful tool for creating interactive reports. By setting up interactions between visuals, you can create a seamless experience for your users, allowing them to explore your data in a more intuitive way.
Best Practices for Linking Visuals in Power BI
There are a few best practices to keep in mind when linking visuals in Power BI. These include:
- Keeping linked visuals close together to make it easier for users to interact with them
- Using bookmarks to create a guided experience for users
- Testing linked visuals to make sure they work as expected
Another important best practice for linking visuals in Power BI is to ensure that the linked visuals are relevant to each other. This means that the visuals should be linked in a way that makes sense to the user and provides them with a clear understanding of the data being presented. Additionally, it is important to consider the order in which the visuals are linked, as this can impact the user’s experience and understanding of the data. By following these best practices, you can create a more effective and user-friendly Power BI report.
Tips for Troubleshooting Linked Visuals in Power BI
If you are experiencing issues with your linked visuals in Power BI, some tips for troubleshooting include:
- Check that all visuals are using the same data source
- Make sure all visuals are formatted correctly
- Make sure that bookmarks are set up correctly
Another tip for troubleshooting linked visuals in Power BI is to check the relationships between the tables in your data model. If the relationships are not set up correctly, it can cause issues with your visuals. You can use the diagram view in Power BI to check and adjust the relationships as needed.
How to Use Linked Visuals to Create Interactive Dashboards in Power BI
Using linked visuals, users can create interactive dashboards in Power BI. To create an interactive dashboard, simply link multiple visuals together and use bookmarks to create a guided user experience.
Linked visuals in Power BI allow users to create a seamless experience for their audience. By linking visuals together, users can create a drill-down effect, where clicking on one visual will filter the data in another visual. This allows for a more interactive experience for the user, as they can explore the data in more detail. Additionally, bookmarks can be used to create a guided experience, where the user is taken through a specific path of visuals to tell a story or highlight important insights.
Advanced Techniques for Linking and Customizing Visuals in Power BI
There are a few advanced techniques that can be used to link and customize visuals in Power BI. These include using custom visuals, creating custom themes, and using Power BI REST APIs.
Custom visuals are a powerful way to extend the functionality of Power BI. They allow you to create custom visualizations that are not available out of the box. You can create custom visuals using the Power BI developer tools, which are available for free. Creating custom visuals requires some programming knowledge, but there are many resources available online to help you get started.
Benefits of Using Linked Visuals in Power BI Reports and Dashboards
The benefits of using linked visuals in Power BI reports and dashboards include:
- Quickly identifying trends and patterns in data
- Providing a guided user experience
- Encouraging users to interact with data and uncover insights
Conclusion: Maximizing Your Insights with Linked Visuals in Power BI
By linking visuals in Power BI, users can create interactive dashboards that provide deeper insights into their data. With a little practice, users can create effective visuals and link them together to create a guided user experience. So, if you want to maximize your insights with Power BI, start linking your visuals today!


