Subscription business model analysis in Excel
Zebra BI for Excel
Overview
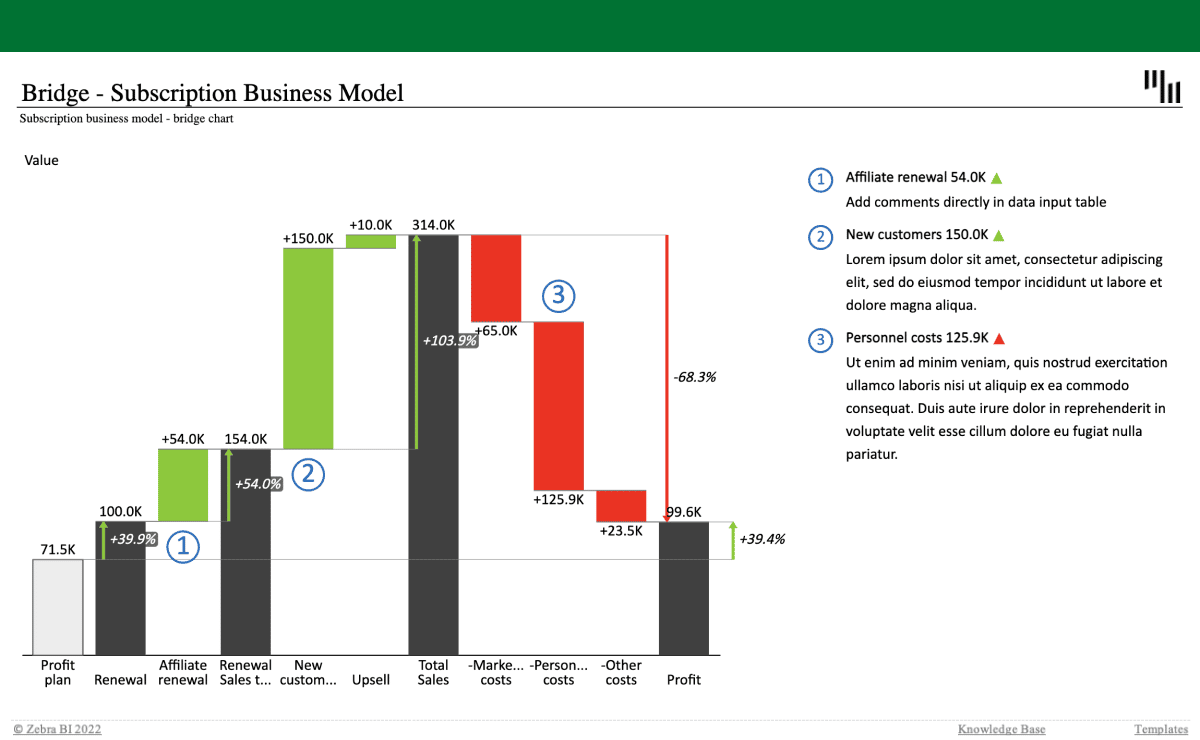
Visualize your profit and costs with a bridge chart to clearly see what drives your subscription business model and where you might have some issues. The combination of custom calculations (invert, result), dynamic comments and automatic variances will provide you with additional context & revealing insights.
Get started in 3 steps
1
Download & Open
Download the .xls file and open it in Excel
2
Connect Your Data
Replace sample data with your CRM, ERP, or database source
3
Customize & Publish
Adjust KPIs, colors, and branding, then publish to Power BI Service
Fill out the form and get the Excel template
20,000+ users have downloaded this template


