Income statement (bridge chart) in Excel
Zebra BI for Excel
Overview
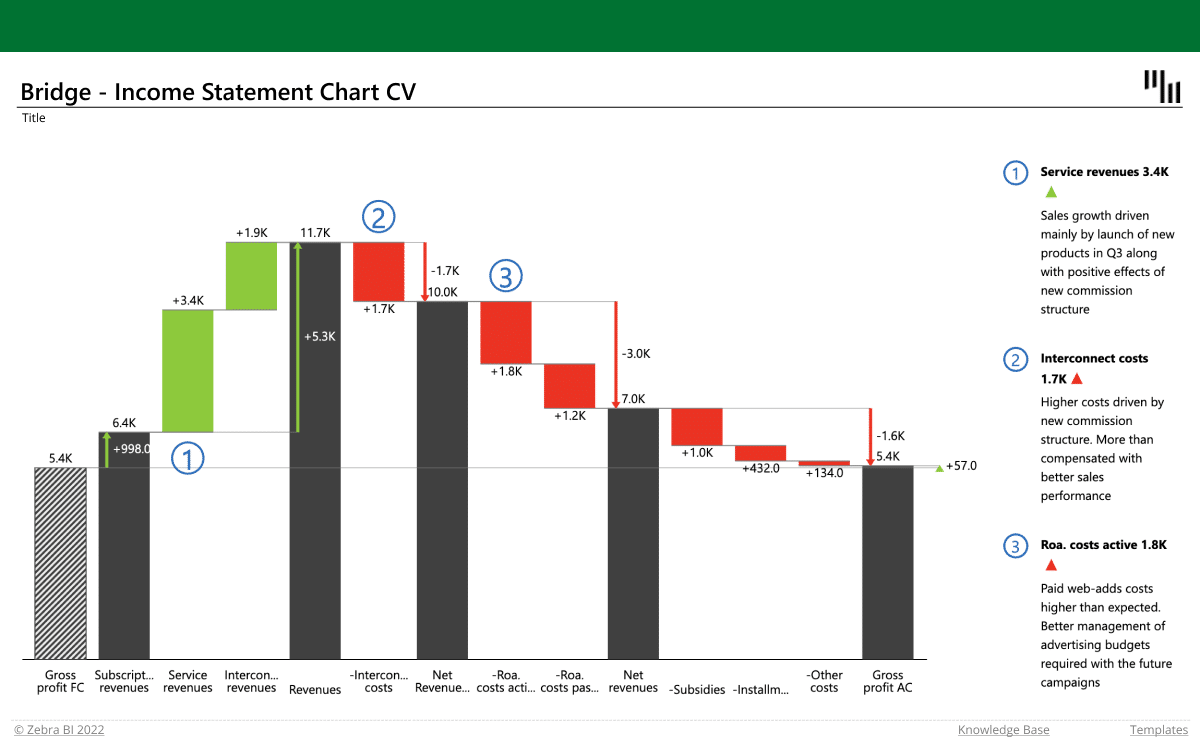
Display your income statement with a bridge chart, using Zebra BI. Show how different accounts contribute to the total value, invert the costs, add dynamic comments and see which account has the biggest impact on your business.
Inside this template
Subtotal difference highlight
Dynamic comments
Automatically calculated variances
Custom calculations
Get started in 3 steps
1
Download & Open
Download the .xls file and open it in Excel
2
Connect Your Data
Replace sample data with your CRM, ERP, or database source
3
Customize & Publish
Adjust KPIs, colors, and branding, then publish to Power BI Service
20,000+ users have downloaded this template


