Consolidated financials dashboard in Excel
Zebra BI for Excel
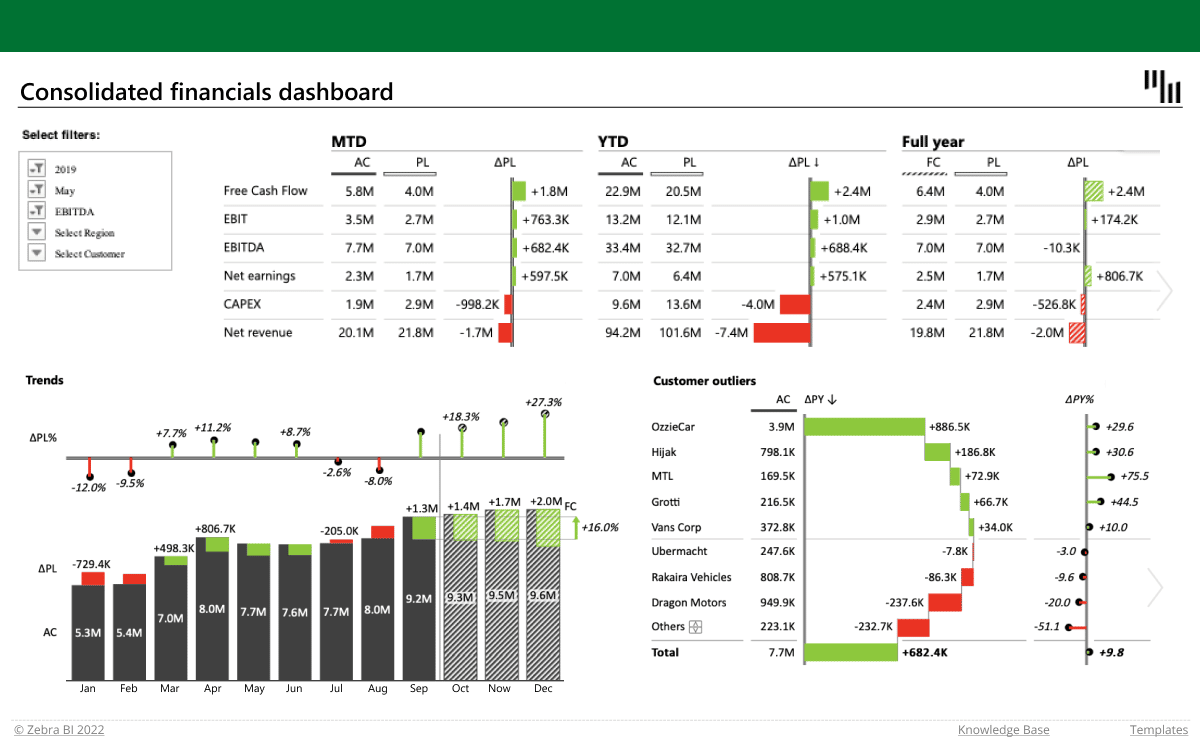
Overview
This Excel template is designed to help you make an actionable overview of financials for the management. The combination of charts & tables lets you visualize the most important information on one page. You can further filter it by year, month, KPI, region, or customer to get more detailed information in seconds.
Get started in 3 steps
1
Download & Open
Download the .xls file and open it in Excel
2
Connect Your Data
Replace sample data with your CRM, ERP, or database source
3
Customize & Publish
Adjust KPIs, colors, and branding, then publish to Power BI Service
20,000+ users have downloaded this template


