EBITDA Split by Location Analysis Excel Template

Overview
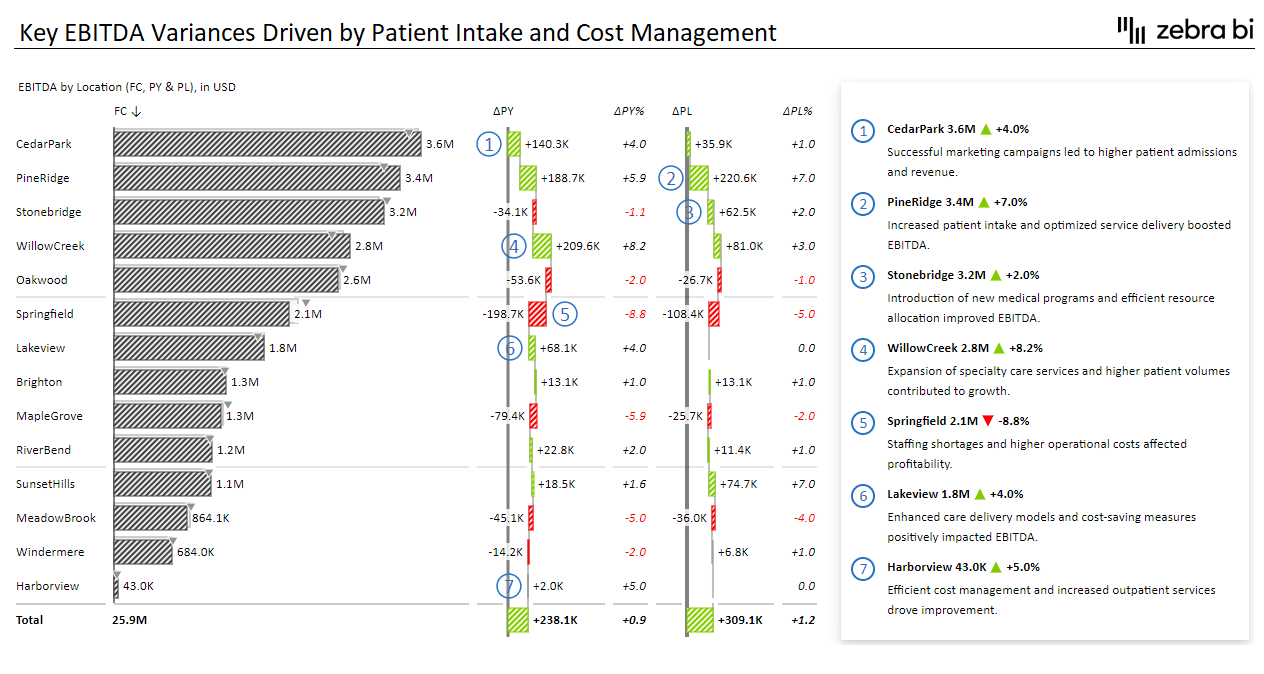
An essential aspect of financial analysis in the healthcare industry is EBITDA split by location analysis. It offers a detailed understanding of each facility's financial performance, serving as a foundation for informed decision-making. Our EBITDA by Location Excel Template equips financial analysts and executives with a comprehensive tool for effortlessly conducting detailed EBITDA analyses by location.
What is the EBITDA Split by Location Analysis and Why is it Important?
EBITDA (Earnings Before Interest, Taxes, Depreciation, and Amortization) split by location analysis breaks down the financial performance of each hospital or healthcare facility within a company. This analysis is crucial for identifying which locations are performing well and which are underperforming, helping to pinpoint areas for improvement and investment.
How and When is it Used, What is the Frequency?
This analysis is typically conducted quarterly or monthly to update each location's financial health regularly. It is used during financial reviews, board meetings, and strategic planning sessions to inform decision-making and resource allocation.
Who Prepares It?
Financial analysts, controllers, and accounting teams within the healthcare company prepare the EBITDA split by location analysis. These professionals gather and process financial data, ensuring accuracy and relevance for strategic discussions.
Who Reads It?
The primary audience includes C-level executives, board members, and senior management. Department heads and operational managers may also review the analysis to understand their respective areas' performance.
What is Important in Visualizing It and Why
Scaling: Ensuring that all data is presented on a consistent scale helps stakeholders quickly grasp the relative performance of each location.
Variances: Highlighting variances from previous periods or budgets identifies trends and deviations that require attention.
Standardized Formatting: Using standardized formatting ensures clarity and ease of comparison across different reports and periods.
Integrated Comments: Adding contextual explanations and comments provides deeper insights into the numbers, helping to explain the reasons behind variances and performance trends. Comments turn raw data into actionable insights, facilitating better decision-making and strategic planning.
Inside this template
Get started in 3 steps
Fill out the form and get the Excel template