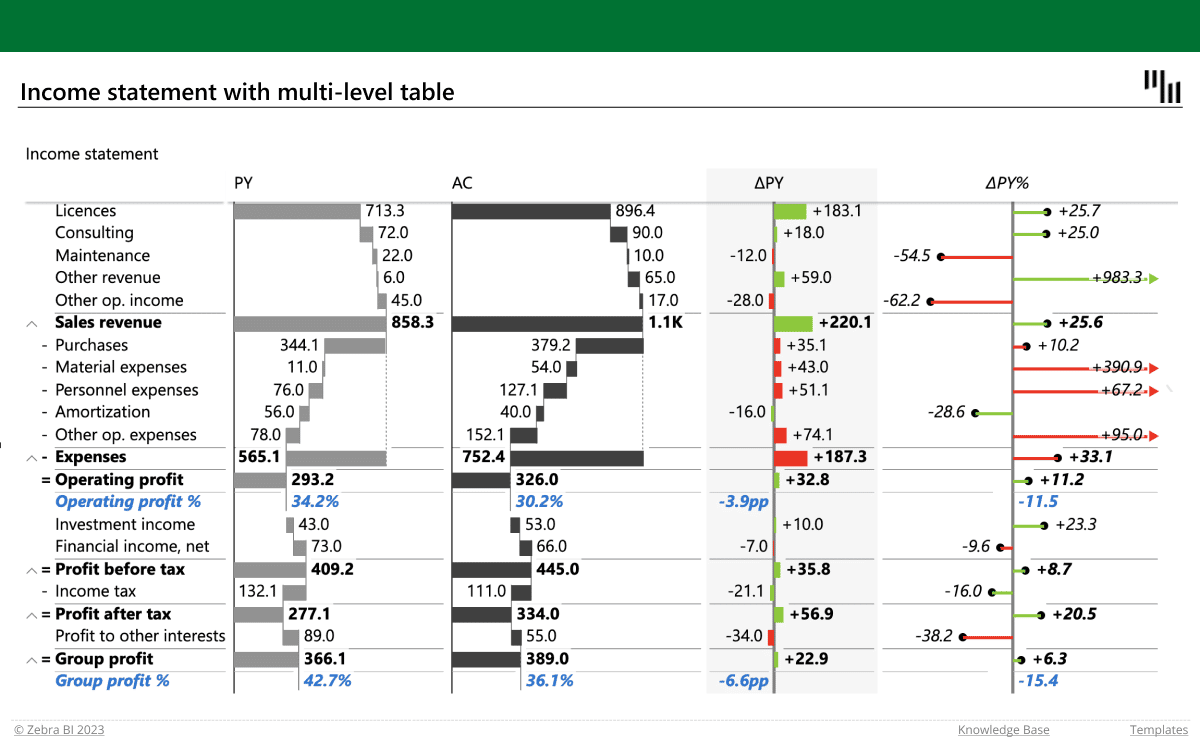
Income statement with multiple levels
Zebra BI for Excel
Overview
In-depth visualization of your Profit & Loss statement as you can add multiple levels of data. Insert your numbers in a pivot table and dive deeper into the details for each category by using the expand & collapse functionality. Together with multiple comparisons & automatically calculated variances you will get your questions answered in no time.
Get started in 3 steps
1
Download & Open
Download the .xls file and open it in Excel
2
Connect Your Data
Replace sample data with your CRM, ERP, or database source
3
Customize & Publish
Adjust KPIs, colors, and branding, then publish to Power BI Service
Fill out the form and get the Excel template
20,000+ users have downloaded this template


