Inventory report
Zebra BI for Excel
Overview
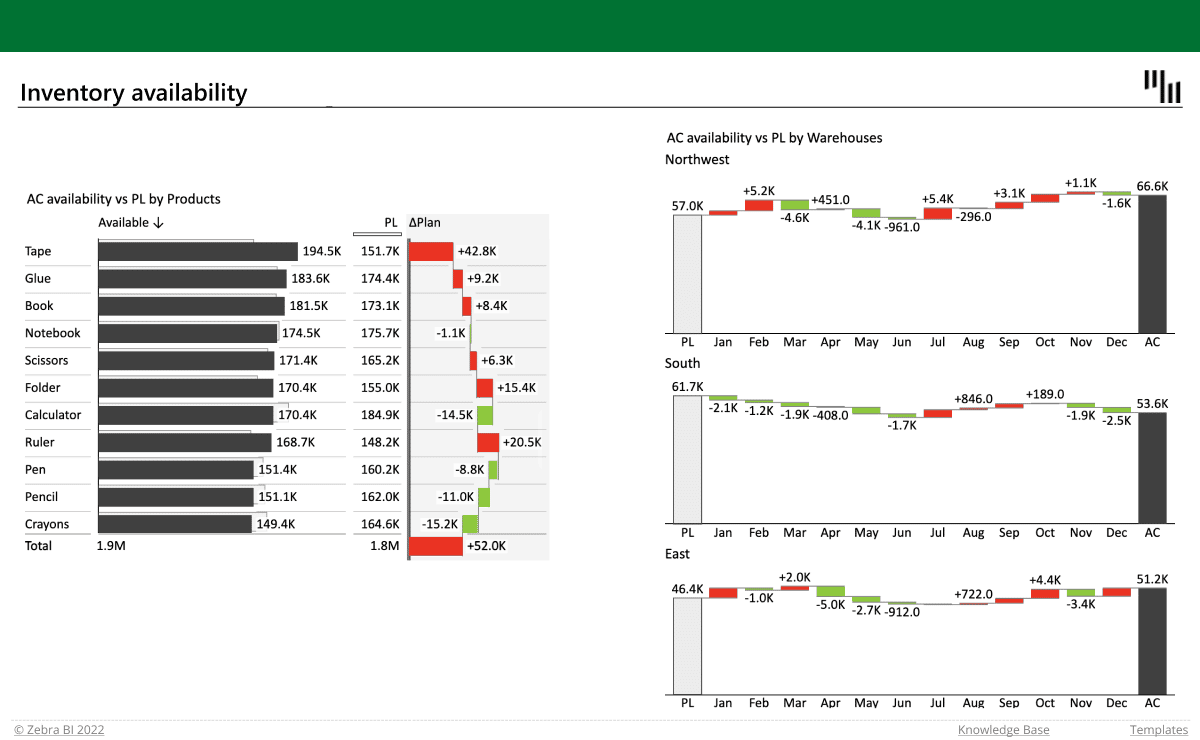
The combination of tables & charts lets you track the stock levels compared to the planned values and understand better the trends for each category. Additionally, you can see how the stock of products differs across several warehouses to gain a better understanding.
Get started in 3 steps
1
Download & Open
Download the .xls file and open it in Excel
2
Connect Your Data
Replace sample data with your CRM, ERP, or database source
3
Customize & Publish
Adjust KPIs, colors, and branding, then publish to Power BI Service
Fill out the form and get the Excel template
20,000+ users have downloaded this template


