Income Statement in Excel (PY-AC) and (AC-PL)

Zebra BI for Excel
Overview
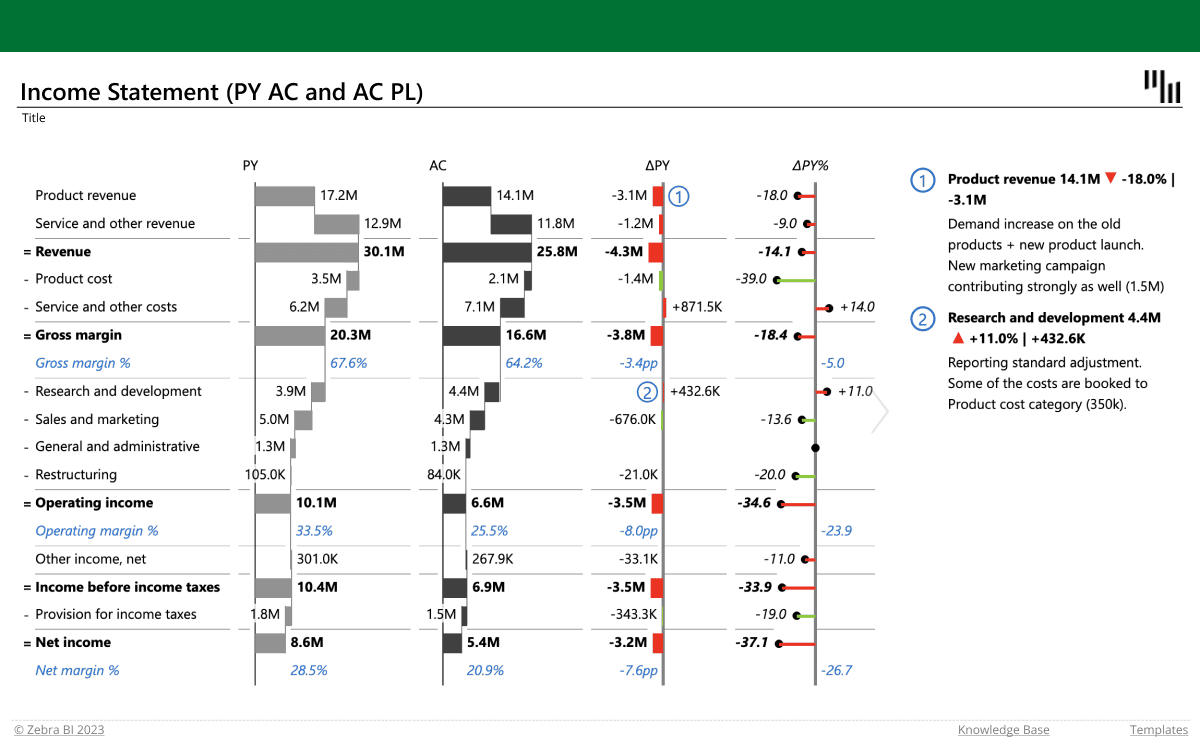
This Excel template allows you to visualize your profit & loss data and compare your actual values with previous year's, using vertical waterfall charts (with features such as formula manager and custom calculations). It also displays absolute and relative variances that are calculated automatically.
Get started in 3 steps
1
Download & Open
Download the .xls file and open it in Excel
2
Connect Your Data
Replace sample data with your CRM, ERP, or database source
3
Customize & Publish
Adjust KPIs, colors, and branding, then publish to Power BI Service
Fill out the form and get the Excel template

20,000+ users have downloaded this template