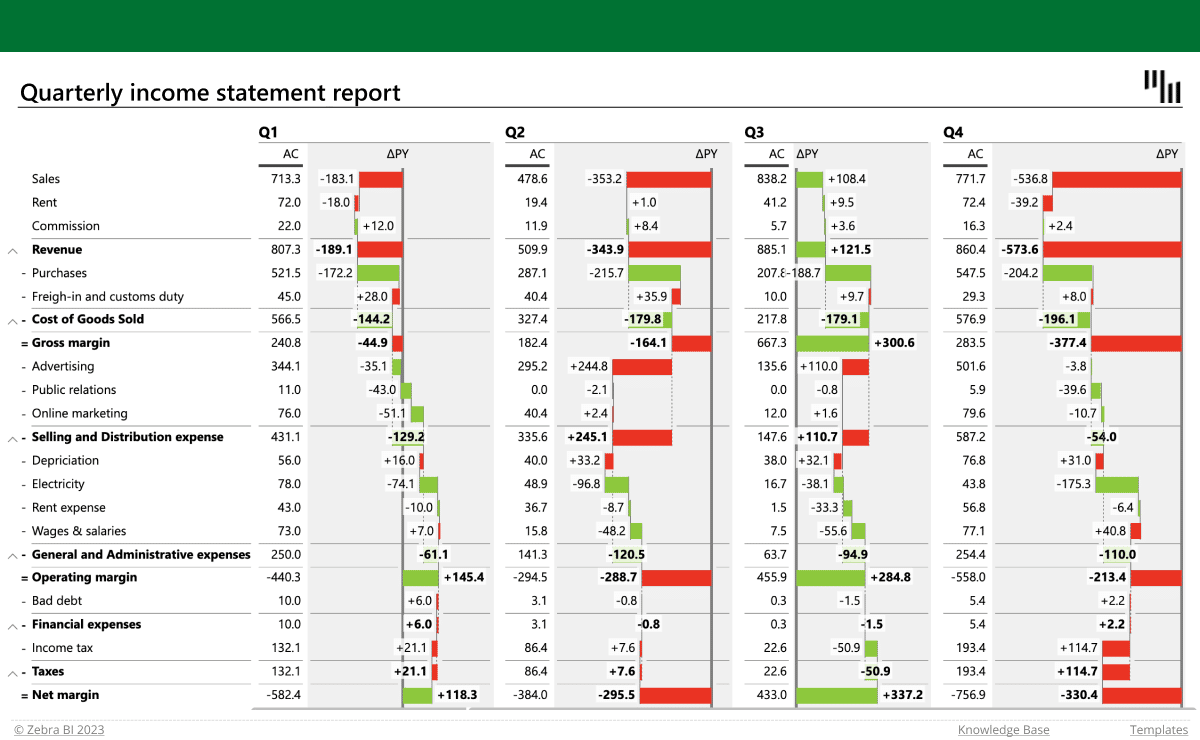
Quarterly income statement

Zebra BI for Excel
Overview
You can track your P&L across time and different channels, giving a bigger picture of the good and bad performance. The time dimension and automatically calculated relative and absolute variances are displayed in columns which you can also hide to ensure better clarity of the report.
Get started in 3 steps
1
Download & Open
Download the .xls file and open it in Excel
2
Connect Your Data
Replace sample data with your CRM, ERP, or database source
3
Customize & Publish
Adjust KPIs, colors, and branding, then publish to Power BI Service
Fill out the form and get the Excel template

20,000+ users have downloaded this template