Sales dashboard in Excel
Zebra BI for Excel
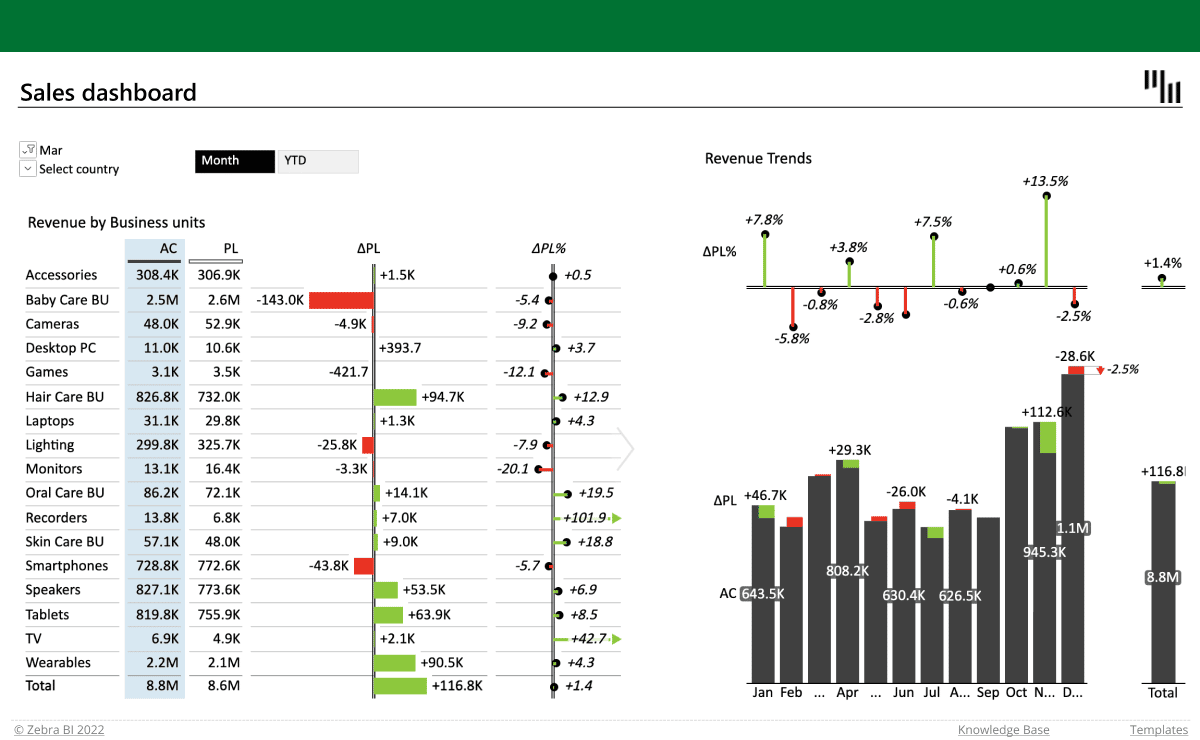
Overview
An interactive template for the complete overview of sales performance with information about products & countries. Get insights about the trends and comparisons to plan. With slicers, you can switch between the month-to-date (MTD) or year-to-date (YTD) view to get the most out of your data.
Get started in 3 steps
1
Download & Open
Download the .xls file and open it in Excel
2
Connect Your Data
Replace sample data with your CRM, ERP, or database source
3
Customize & Publish
Adjust KPIs, colors, and branding, then publish to Power BI Service
Fill out the form and get the Excel template
20,000+ users have downloaded this template


