Monthly Sales Variances in Excel (AC-FC-PL)
Zebra BI for Excel
Overview
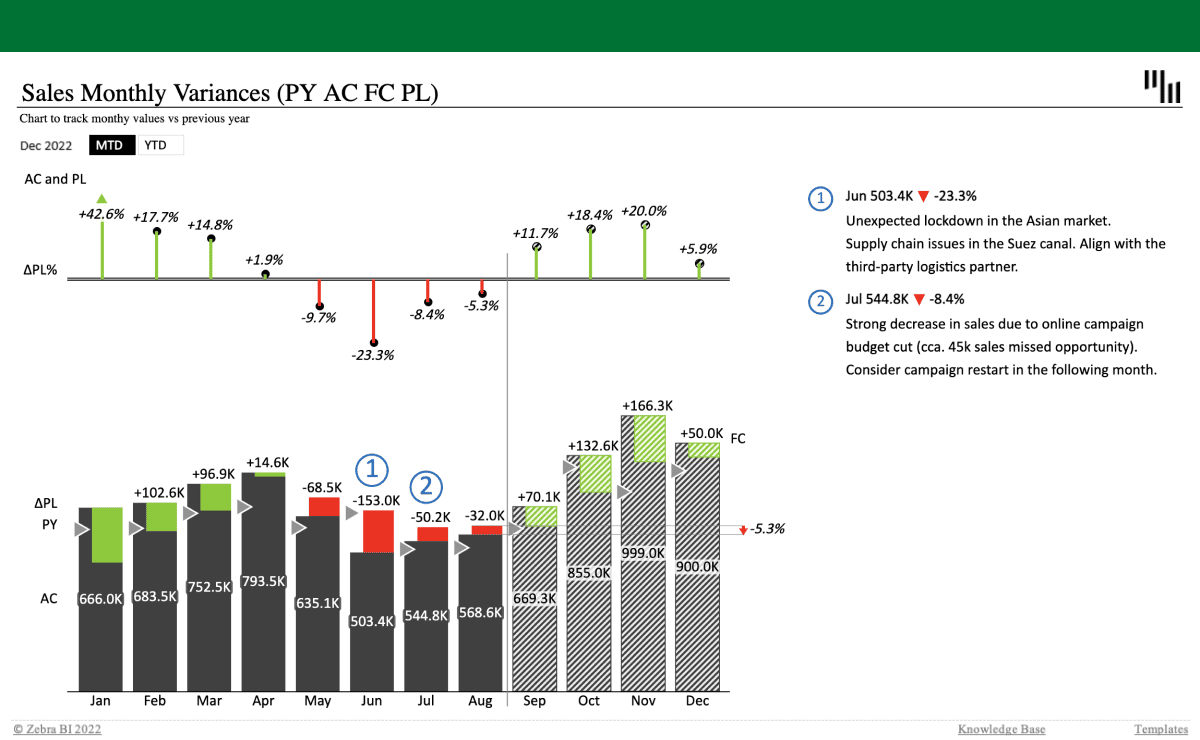
This is a monthly sales variance Excel template that analyses trends over time by comparing the actual (AC), forecasted (FC) and planned data (PL) in the same chart. It features automatically calculated variances presented in a horizontal variance chart, together with dynamic comments for more information.
Get started in 3 steps
1
Download & Open
Download the .xls file and open it in Excel
2
Connect Your Data
Replace sample data with your CRM, ERP, or database source
3
Customize & Publish
Adjust KPIs, colors, and branding, then publish to Power BI Service
Fill out the form and get the Excel template
20,000+ users have downloaded this template


